

The Global Economic Impact of Private Equity Report 2008 - World ...
The Global Economic Impact of Private Equity Report 2008 - World ...
The Global Economic Impact of Private Equity Report 2008 - World ...
- No tags were found...

You also want an ePaper? Increase the reach of your titles
YUMPU automatically turns print PDFs into web optimized ePapers that Google loves.
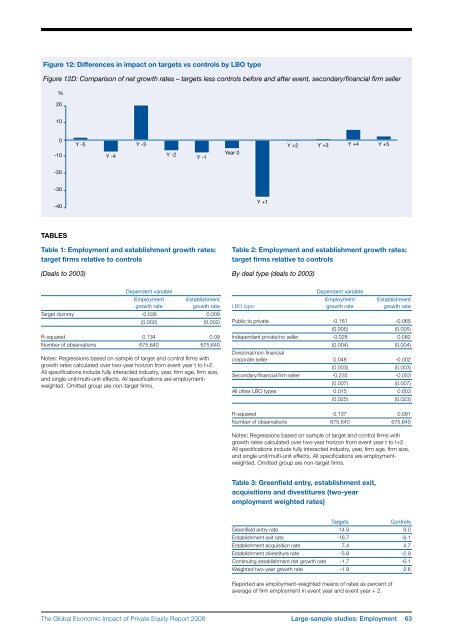
Figure 12: Differences in impact on targets vs controls by LBO typeFigure 12D: Comparison <strong>of</strong> net growth rates – targets less controls before and after event, secondary/financial firm seller%20100-10Y -5Y -3Y -4 Y -2Y -1Year 0Y +2 Y +3 Y +4 Y +5-20-30-40Y +1tablesTable 1: Employment and establishment growth rates:target firms relative to controls(Deals to 2003)Table 2: Employment and establishment growth rates:target firms relative to controlsBy deal type (deals to 2003)Dependent variableEmploymentgrowth rateEstablishmentgrowth rateTarget dummy -0.036 0.009(0.002) (0.002)R-squared 0.134 0.09Number <strong>of</strong> observations 675,640 675,640Notes: Regressions based on sample <strong>of</strong> target and control firms withgrowth rates calculated over two-year horizon from event year t to t+2.All specifications include fully interacted industry, year, firm age, firm size,and single unit/multi-unit effects. All specifications are employmentweighted.Omitted group are non-target firms.Dependent variableEmployment EstablishmentLBO type: growth rate growth ratePublic to private -0.161 -0.065(0.005) (0.005)Independent private/no seller -0.028 0.082(0.004) (0.004)Divisional/non-financialcorporate seller 0.048 -0.002(0.003) (0.003)Secondary/financial firm seller -0.235 -0.053(0.007) (0.007)All other LBO types 0.015 0.003(0.025) (0.023)R-squared 0.137 0.091Number <strong>of</strong> observations 675,640 675,640Notes: Regressions based on sample <strong>of</strong> target and control firms withgrowth rates calculated over two-year horizon from event year t to t+2.All specifications include fully interacted industry, year, firm age, firm size,and single unit/multi-unit effects. All specifications are employmentweighted.Omitted group are non-target firms.Table 3: Greenfield entry, establishment exit,acquisitions and divestitures (two-yearemployment weighted rates)TargetsControlsGreenfield entry rate 14.9 9.0Establishment exit rate -16.7 -8.1Establishment acquisition rate 7.4 4.7Establishment divestiture rate -5.8 -2.9Continuing establishment net growth rate -1.7 -0.1Weighted two-year growth rate -1.9 2.6<strong>Report</strong>ed are employment-weighted means <strong>of</strong> rates as percent <strong>of</strong>average <strong>of</strong> firm employment in event year and event year + 2.<strong>The</strong> <strong>Global</strong> <strong>Economic</strong> <strong>Impact</strong> <strong>of</strong> <strong>Private</strong> <strong>Equity</strong> <strong>Report</strong> <strong>2008</strong> Large-sample studies: Employment 63


