Exhibit 3: New Look key financialsIn £ millionCAGR CAGR1998/99 - 2003/04 -Key financials 1999/00 2000/01 2001/02 2002/03 2003/04 2004/05 2005/06 2006/07 2002/03 2006/07Sales (ex. vat) 419 470 584 643 696 813 862 1,017 15.4% 13.5%% Growth 12.2% 24.3% 10.1% 8.2% 16.9% 6.0% 18.0%EBITDA 62 50 84 109 118 160 174 177 20.7% 14.6%% <strong>of</strong> Sales 14.8% 10.6% 14.4% 17.0% 16.9% 19.6% 20.2% 17.4%% Growth (28.1%) 35.1% 17.9% (0.4%) 16.2% 2.8% (14.0%)CAPEX 31 28 20 39 42 59 70 98 8.0% 32.6%% Growth (9.7%) (28.6%) 95.0% 7.7% 40.5% 18.6% 40.0%Source: New Look, casewriters’ research.Exhibit 4: Employment development at New Look (2003/04 – 2006/07)Average group employeesCAGRTotal 2003/04 -2003/04 2004/05 2005/06 2006/07 change 2006/07Retailing 11,020 11,428 12,754 14,806 3,786 10.3%Admin & distribution 1,146 1,141 1,021 902 (244) (7.7%)Total group employees 12,166 12,569 13,775 15,708 3,542 8.9%Group FTE employees 6,498 6,942 7,377 8,120 1,622 7.7%Average UK employeesUK employees 10,999 11,216 11,912 13,410 2,411 6.8%UK FTE employees 5,548 5,928 5,976 6,689 1,141 6.4%Employee cost (in £ million)Branch 66 74 82 101 14.9%Distribution 16 17 18 25 17.6%Head <strong>of</strong>fice 22 23 28 28 8.2%Total employee cost 104 113 129 154 14.0%Employee cost per FTE employee (in £ thousands) 19 19 22 23 7.1%Employee productivity (in £ thousands)Revenue per FTE employee 107 117 117 125 5.4%EBITDA per FTE employee 18 23 24 22 6.4%Source: New Look.110 Case studies: New Look<strong>The</strong> <strong>Global</strong> <strong>Economic</strong> <strong>Impact</strong> <strong>of</strong> <strong>Private</strong> <strong>Equity</strong> <strong>Report</strong> <strong>2008</strong>
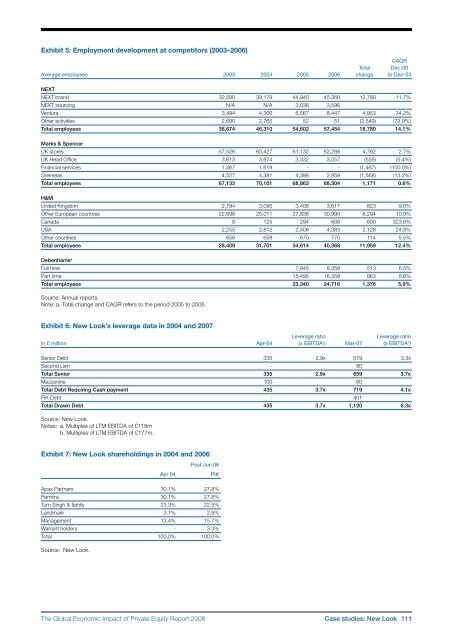
Exhibit 5: Employment development at competitors (2003–2006)CAGRTotal Dec-00Average employees 2003 2004 2005 2006 change to Dec-03NEXTNEXT brand 32,580 39,179 44,945 45,360 12,780 11.7%NEXT sourcing N/A N/A 3,038 3,596Ventura 3,494 4,366 6,567 8,447 4,953 34.2%Other activities 2,600 2,765 52 51 (2,549) (73.0%)Total employees 38,674 46,310 54,602 57,454 18,780 14.1%Marks & SpencerUK stores 57,526 60,427 61,132 62,288 4,762 2.7%UK Head Office 3,613 3,674 3,332 3,057 (556) (5.4%)Financial services 1,467 1,619 ‐ ‐ (1,467) (100.0%)Overseas 4,527 4,381 4,399 2,959 (1,568) (13.2%)Total employees 67,133 70,101 68,863 68,304 1,171 0.6%H&MUnited Kingdom 2,794 3,095 3,408 3,617 823 9.0%Other European countries 22,696 25,011 27,836 30,990 8,294 10.9%Canada 8 125 294 608 600 323.6%USA 2,255 2,812 2,406 4,383 2,128 24.8%Other countries 656 658 670 770 114 5.5%Total employees 28,409 31,701 34,614 40,368 11,959 12.4%Debenhams aFull time 7,845 8,358 513 6.5%Part time 15,495 16,358 863 5.6%Total employees 23,340 24,716 1,376 5.9%Source: Annual reports.Note: a. Total change and CAGR refers to the period 2005 to 2006.Exhibit 6: New Look’s leverage data in 2004 and 2007Leverage ratioLeverage ratioIn £ million Apr-04 (x EBITDA a ) Mar-07 (x EBITDA b )Senior Debt 335 2.9x 579 3.3xSecond Lien ‐ 80Total Senior 335 2.9x 659 3.7xMezzanine 100 60Total Debt Requiring Cash payment 435 3.7x 719 4.1xPiK Debt ‐ 401Total Drawn Debt 435 3.7x 1,120 6.3xSource: New Look.Notes: a. Multiples <strong>of</strong> LTM EBITDA <strong>of</strong> £118mb. Multiples <strong>of</strong> LTM EBITDA <strong>of</strong> £177m.Exhibit 7: New Look shareholdings in 2004 and 2006Post Jun 06Apr 04PIKApax Partners 30.1% 27.8%Permira 30.1% 27.8%Tom Singh & family 23.3% 22.5%Landmark 3.1% 2.9%Management 13.4% 15.7%Warrant holders ‐ 3.3%Total 100.0% 100.0%Source: New Look.<strong>The</strong> <strong>Global</strong> <strong>Economic</strong> <strong>Impact</strong> <strong>of</strong> <strong>Private</strong> <strong>Equity</strong> <strong>Report</strong> <strong>2008</strong> Case studies: New Look 111
- Page 2 and 3:
The Globalization of Alternative In
- Page 5:
ContributorsCo-editorsAnuradha Guru
- Page 9 and 10:
PrefaceKevin SteinbergChief Operati
- Page 11 and 12:
Letter on behalf of the Advisory Bo
- Page 13 and 14:
Executive summaryJosh lernerHarvard
- Page 15 and 16:
• Private equity-backed companies
- Page 17 and 18:
C. Indian casesThe two India cases,
- Page 19 and 20:
Part 1Large-sample studiesThe Globa
- Page 21 and 22:
The new demography of private equit
- Page 23 and 24:
among US publicly traded firms, it
- Page 25 and 26:
should be fairly complete. While th
- Page 27 and 28:
according to Moody’s (Hamilton et
- Page 29 and 30:
draining public markets of firms. I
- Page 31 and 32:
FIguresFigure 1A: LBO transactions
- Page 33 and 34:
TablesTable 1: Capital IQ 1980s cov
- Page 35 and 36:
Table 2: Magnitude and growth of LB
- Page 37 and 38:
Table 4: Exits of individual LBO tr
- Page 39 and 40:
Table 6: Determinants of exit succe
- Page 41 and 42:
Table 7: Ultimate staying power of
- Page 43 and 44:
Appendix 1: Imputed enterprise valu
- Page 45 and 46:
Private equity and long-run investm
- Page 47 and 48:
alternative names associated with t
- Page 49 and 50:
4. Finally, we explore whether firm
- Page 51 and 52:
When we estimate these regressions,
- Page 53 and 54:
cutting back on the number of filin
- Page 55 and 56:
Table 1: Summary statisticsPanel D:
- Page 57 and 58:
Table 4: Relative citation intensit
- Page 59 and 60:
figuresFigure 1: Number of private
- Page 61 and 62:
Private equity and employment*steve
- Page 63 and 64:
Especially when taken together, our
- Page 65 and 66:
centred on the transaction year ide
- Page 67 and 68:
and Vartia 1985.) Aggregate employm
- Page 69 and 70:
sectors. In Retail Trade, the cumul
- Page 71 and 72:
employment-weighted acquisition rat
- Page 73 and 74:
FIguresFigure 1: Matches of private
- Page 75 and 76:
Figure 6:Figure 6A: Comparison of n
- Page 77 and 78: Figure 8:Figure 8A: Comparison of j
- Page 79 and 80: Figure 11: Variation in impact in e
- Page 81 and 82: Figure 12: Differences in impact on
- Page 83 and 84: Private equity and corporate govern
- Page 85 and 86: et al (2007) track the evolution of
- Page 87 and 88: groups aim to improve firm performa
- Page 89 and 90: distribution of the LBO sponsors, m
- Page 91 and 92: the most difficult cases. This stor
- Page 93 and 94: to see whether these changes of CEO
- Page 95 and 96: Figure 3:This figure represents the
- Page 97 and 98: TablesTable 1: Company size descrip
- Page 99 and 100: Table 5: Changes in the board size,
- Page 101 and 102: Table 7: Board turnoverPanel A: Siz
- Page 103 and 104: Part 2Case studiesThe Global Econom
- Page 105 and 106: European private equity cases: intr
- Page 107 and 108: Exhibit 1: Private equity fund size
- Page 109 and 110: Messer Griesheimann-kristin achleit
- Page 111 and 112: ealized it was not possible to grow
- Page 113 and 114: The deal with Allianz Capital partn
- Page 115 and 116: the deal, the private equity invest
- Page 117 and 118: Exhibit 1: The Messer Griesheim dea
- Page 119 and 120: Exhibit 5: Post buyout structureMes
- Page 121 and 122: New Lookann-kristin achleitnerTechn
- Page 123 and 124: feet. This restricted store space w
- Page 125 and 126: institutional investors why this in
- Page 127: Although a public listing did not a
- Page 131 and 132: Chinese private equity cases: intro
- Page 133 and 134: Hony Capital and China Glass Holdin
- Page 135 and 136: Hony’s Chinese name means ambitio
- Page 137 and 138: Establishing early agreement on pos
- Page 139 and 140: Executing the IPOEach of the initia
- Page 141 and 142: Exhibit 1A: Summary of Hony Capital
- Page 143 and 144: Exhibit 4: Members of the China Gla
- Page 145 and 146: Exhibit 6A: China Glass post‐acqu
- Page 147 and 148: Exhibit 8: China Glass stock price
- Page 149 and 150: 3i Group plc and Little Sheep*Lily
- Page 151 and 152: y an aggressive franchise strategy,
- Page 153 and 154: soul” of the business. But there
- Page 155 and 156: Exhibit 1: Summary information on 3
- Page 157 and 158: Exhibit 6: An excerpt from the 180-
- Page 159 and 160: Indian private equity cases: introd
- Page 161 and 162: ICICI Venture and Subhiksha *Lily F
- Page 163 and 164: investment,” recalled Deshpande.
- Page 165 and 166: 2005 - 2007: Moderator, protector a
- Page 167 and 168: Exhibit 3: Subhiksha’s board comp
- Page 169 and 170: Warburg Pincus and Bharti Tele‐Ve
- Page 171 and 172: founded two companies at this time
- Page 173 and 174: By 2003 this restructuring task was
- Page 175 and 176: Exhibit 1C: Private equity investme
- Page 177 and 178: Exhibit 4B: Bharti cellular footpri
- Page 179 and 180:
Exhibit 6: Summary of Bharti’s fi
- Page 181 and 182:
Exhibit 7: Bharti’s board structu
- Page 183 and 184:
In the 1993‐94 academic year, he
- Page 185 and 186:
consumer products. She was also a R
- Page 187 and 188:
AcknowledgementsJosh LernerHarvard
- Page 189:
The World Economic Forum is an inde