

The Global Economic Impact of Private Equity Report 2008 - World ...
The Global Economic Impact of Private Equity Report 2008 - World ...
The Global Economic Impact of Private Equity Report 2008 - World ...
- No tags were found...

You also want an ePaper? Increase the reach of your titles
YUMPU automatically turns print PDFs into web optimized ePapers that Google loves.
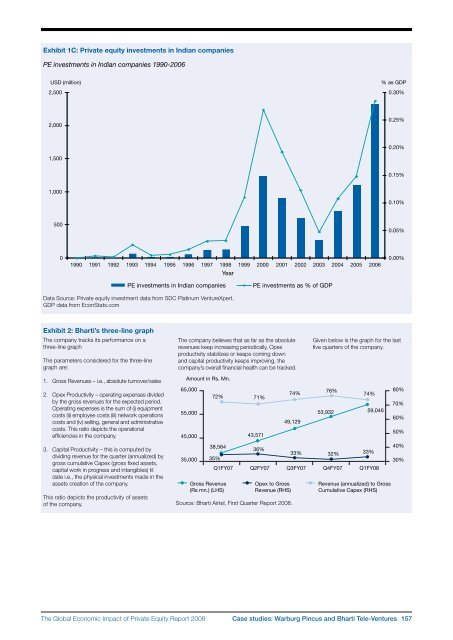
Exhibit 1C: <strong>Private</strong> equity investments in Indian companiesPE investments in Indian companies 1990-2006USD (million)2,500% as GDP0.30%2,0000.25%0.20%1,5000.15%1,0000.10%5000.05%01990 1991 1992 1993 1994 1995 1996 1997 1998 1999 2000 2001 2002 2003 2004 2005 2006Year0.00%PE investments in Indian companiesPE investments as % <strong>of</strong> GDPData Source: <strong>Private</strong> equity investment data from SDC Platinum VentureXpert.GDP data from EconStats.comExhibit 2: Bharti’s three-line graph<strong>The</strong> company tracks its performance on athree‐line graph<strong>The</strong> parameters considered for the three‐linegraph are:<strong>The</strong> company believes that as far as the absoluterevenues keep increasing periodically, Opexproductivity stabilizes or keeps coming downand capital productivity keeps improving, thecompany’s overall financial health can be tracked.Given below is the graph for the lastfive quarters <strong>of</strong> the company.1. Gross Revenues – i.e., absolute turnover/salesAmount in Rs. Mn.2. Opex Productivity – operating expenses dividedby the gross revenues for the expected period.Operating expenses is the sum <strong>of</strong> (i) equipmentcosts (ii) employee costs (iii) network operationscosts and (iv) selling, general and administrativecosts. This ratio depicts the operationalefficiencies in the company.65,00055,00045,00072%71%43,57174%49,12976%53,93274%59,04680%70%60%50%3. Capital Productivity – this is computed bydividing revenue for the quarter (annualized) bygross cumulative Capex (gross fixed assets,capital work in progress and intangibles) tildate i.e., the physical investments made in theassets creation <strong>of</strong> the company.This ratio depicts the productivity <strong>of</strong> assets<strong>of</strong> the company.35,00038,56435%Q1FY07Gross Revenue(Rs mn.) (LHS)36%Opex to GrossRevenue (RHS)Source: Bharti Airtel, First Quarter <strong>Report</strong> <strong>2008</strong>.33% 32% 33%Q2FY07 Q3FY07 Q4FY07 Q1FY08Revenue (annualized) to GrossCumulative Capex (RHS)40%30%<strong>The</strong> <strong>Global</strong> <strong>Economic</strong> <strong>Impact</strong> <strong>of</strong> <strong>Private</strong> <strong>Equity</strong> <strong>Report</strong> <strong>2008</strong> Case studies: Warburg Pincus and Bharti Tele‐Ventures 157


