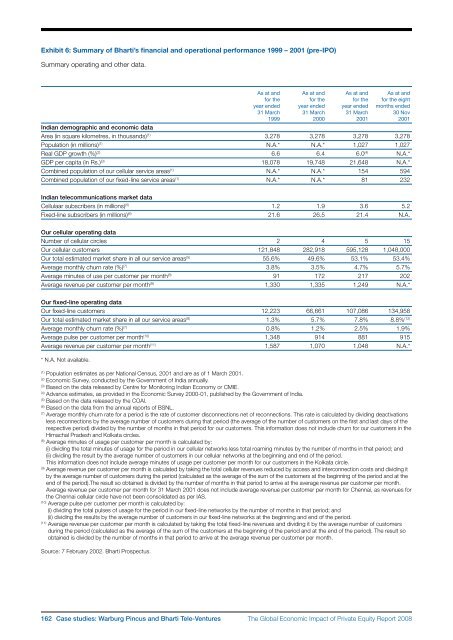
Exhibit 6: Summary <strong>of</strong> Bharti’s financial and operational performance 1999 – 2001 (pre-IPO)Summary operating and other data.As at and As at and As at and As at andfor the for the for the for the eightyear ended year ended year ended months ended31 March 31 March 31 March 30 Nov1999 2000 2001 2001Indian demographic and economic dataArea (in square kilometres, in thousands) (1) 3,278 3,278 3,278 3,278Population (in millions) (1) N.A.* N.A.* 1,027 1,027Real GDP growth (%) (2) 6.6 6.4 6.0 (4) N.A.*GDP per capita (in Rs.) (3) 18,078 19,748 21,648 N.A.*Combined population <strong>of</strong> our cellular service areas (1) N.A.* N.A.* 154 594Combined population <strong>of</strong> our fixed-line service areas (1) N.A.* N.A.* 81 232Indian telecommunications market dataCellulaar subscribers (in millions) (5) 1.2 1.9 3.6 5.2Fixed-line subscribers (in millions) (6) 21.6 26.5 21.4 N.A.Our cellular operating dataNumber <strong>of</strong> cellular circles 2 4 5 15Our cellular customers 121,848 282,918 595,128 1,048,000Our total estimated market share in all our service areas (5) 55.6% 49.6% 53.1% 53.4%Average monthly churn rate (%) (7) 3.8% 3.5% 4.7% 5.7%Average minutes <strong>of</strong> use per customer per month (8) 91 172 217 202Average revenue per customer per month (9) 1,330 1,335 1,249 N.A.*Our fixed-line operating dataOur fixed-line customers 12,223 66,661 107,086 134,958Our total estimated market share in all our service areas (8) 1.3% 5.7% 7.8% 8.8% (12)Average monthly churn rate (%) (7) 0.8% 1.2% 2.5% 1.9%Average pulse per customer per month (10) 1,348 914 881 915Average revenue per customer per month (11) 1,587 1,070 1,048 N.A.** N.A. Not available.(1)Population estimates as per National Census, 2001 and are as <strong>of</strong> 1 March 2001.(2)<strong>Economic</strong> Survey, conducted by the Government <strong>of</strong> India annually.(3)Based on the data released by Centre for Monitoring Indian Economy or CMIE.(4)Advance estimates, as provided in the <strong>Economic</strong> Survey 2000-01, published by the Government <strong>of</strong> India.(5)Based on the data released by the COAl.(6)Based on the data from the annual reports <strong>of</strong> BSNL.(7)Average monthly churn rate for a period is the rate <strong>of</strong> customer disconnections net <strong>of</strong> reconnections. This rate is calculated by dividing deactivationsless reconnections by the average number <strong>of</strong> customers during that period (the average <strong>of</strong> the number <strong>of</strong> customers on the first and last days <strong>of</strong> therespective period) divided by the number <strong>of</strong> months in that period for our customers. This information does not include churn for our customers in theHimachal Pradesh and Kolkata circles.(8)Average minutes <strong>of</strong> usage per customer per month is calculated by:(i) dividing the total minutes <strong>of</strong> usage for the period in our cellular networks less total roaming minutes by the number <strong>of</strong> months in that period; and(ii) dividing the result by the average number <strong>of</strong> customers in our cellular networks at the beginning and end <strong>of</strong> the period.This information does not include average minutes <strong>of</strong> usage per customer per month for our customers in the Kolkata circle.(9)Average revenue per customer per month is calculated by taking the total cellular revenues reduced by access and interconnection costs and dividing itby the average number <strong>of</strong> customers during the period (calculated as the average <strong>of</strong> the sum <strong>of</strong> the customers at the beginning <strong>of</strong> the period and at theend <strong>of</strong> the period).<strong>The</strong> result so obtained is divided by the number <strong>of</strong> months in that period to arrive at the average revenue per customer per month.Average revenue per customer per month for 31 March 2001 does not include average revenue per customer per month for Chennai, as revenues forthe Chennai cellular circle have not been consolidated as per IAS.(10)Average pulse per customer per month is calculated by:(i) dividing the total pulses <strong>of</strong> usage for the period in our fixed-line networks by the number <strong>of</strong> months in that period; and(ii) dividing the results by the average number <strong>of</strong> customers in our fixed-line networks at the beginning and end <strong>of</strong> the period.(11)Average revenue per customer per month is calculated by taking the total fixed-line revenues and dividing it by the average number <strong>of</strong> customersduring the period (calculated as the average <strong>of</strong> the sum <strong>of</strong> the customers at the beginning <strong>of</strong> the period and at the end <strong>of</strong> the period). <strong>The</strong> result soobtained is divided by the number <strong>of</strong> months in that period to arrive at the average revenue per customer per month.Source: 7 February 2002. Bharti Prospectus.162 Case studies: Warburg Pincus and Bharti Tele‐Ventures<strong>The</strong> <strong>Global</strong> <strong>Economic</strong> <strong>Impact</strong> <strong>of</strong> <strong>Private</strong> <strong>Equity</strong> <strong>Report</strong> <strong>2008</strong>
Exhibit 7: Bharti’s board structureSunil Bharti Mittal, Chairman & Managing Director.A graduate from Punjab University, he has completed the‘Owner/President Management Programme’ from HarvardBusiness School in 1999. <strong>The</strong> founder <strong>of</strong> the Bharti Group,he joined the board at the time <strong>of</strong> incorporation <strong>of</strong> BTVL inJuly 1995. He is the founder, past president and chairman<strong>of</strong> various telecoms industry associations.Rajan Bharti Mittal, Joint Managing Director. A graduatefrom Punjab University, he has over 20 years <strong>of</strong> experiencein the industry. Joined the board at the time <strong>of</strong> incorporation<strong>of</strong> BTVL in July 1995. He is the chairman <strong>of</strong> FICCI TelecomCommittee as well as the PHDCCI Telecom Committee anda member <strong>of</strong> the Managing Committee <strong>of</strong> the PHDCCI.Bashir Abdulla Currimjee, Independent Non‐ExecutiveDirector. A graduate from Tufts University, USA. He is theChairman <strong>of</strong> Currimjee Group, Mauritius, one <strong>of</strong> the largestcommercial business groups which operate in areas such astelecommunications, energy, financial services and tradingactivities in Mauritius, South Africa, the Middle East, Indiaand the Seychelles. Joined the board in February 2001.Chua Sock Koong, Non‐Executive Director. Nominated bySingTel. A graduate from University <strong>of</strong> Singapore, Ms Chua isa certified accountant and a chartered financial analyst. ChiefFinancial Officer <strong>of</strong> SingTel since April 1999. Joined the boardin May 2001. Ms Chua is responsible for the overseasinvestments <strong>of</strong> SingTel.Rakesh Bharti Mittal, Non‐Executive Director. An electronicsengineer from YMCA Institute <strong>of</strong> Engineering, with over 25years <strong>of</strong> industry experience. Currently the vice chairman andmanaging director <strong>of</strong> Bharti Enterprises. Joined the board atthe time <strong>of</strong> incorporation <strong>of</strong> BTVL in July 1995. Currently heheads the national committee on consumer affairs <strong>of</strong> CII.Akhil Gupta, Joint Managing Director. A commerce graduateand chartered accountant, he has over 20 years <strong>of</strong>pr<strong>of</strong>essional experience. Joined the board in April 1996.Mr Gupta was adjudged as the ‘Chief Financial Officer forthe year 2001 for Merger & Acquisitions’ by the <strong>Economic</strong>Intelligence Unit, India in association with American Express.N. Kumar, Independent Non‐Executive Director. An engineerin Electronics and Communications, he is the vice chairman<strong>of</strong> the Sanmar Group <strong>of</strong> companies with operations inchemicals, thermoplastic resins, cement, shipping, electronicsand footwear. Joined the board in November 2001.P. M. Sinha, Independent Non‐Executive Director. Analumnus <strong>of</strong> Massachusetts Institute <strong>of</strong> Technology’s SloanSchool <strong>of</strong> Management, and formerly chairman <strong>of</strong> PepsicoIndia Holdings and general manager <strong>of</strong> Pepsico BeverageInternational for South Asia. Joined the board in November2001. He is also on the board <strong>of</strong> Lafarge India, Wipro, AzimPremji Foundation, ICICI Bank and Electrolux.Dalip Pathak, Independent Non‐Executive Director. Holdsa Master’s in Business Administration from the WhartonSchool, University <strong>of</strong> Pennsylvania, USA. He has been withWarburg Pincus since 1994 and is now managing directorheading Singapore Operations covering South and SouthEast Asian operations. Joined the board in September 1999.Donald Cameron, Independent Non‐Executive Director.A chemical engineer, he has a Master’s in <strong>Economic</strong>s andAdministration in Petroleum Industry, from LoughboroughUniversity, UK, and over 32 years <strong>of</strong> experience in thepetroleum and telecommunications industries. Joined theboard in September 2001.Lim Toon, Non‐Executive Director. Nominated by SingTel.An engineer, he has a Post-Graduate Diploma in BusinessAdministration from the University <strong>of</strong> Singapore. With over 30years <strong>of</strong> experience in planning, implementation and operation<strong>of</strong> telecommunications services, he is COO <strong>of</strong> SingTel sinceApril 1999. Joined the board in November 2000.Pulak Chandan Prasad, Independent Non‐ExecutiveDirector. An engineer from IIT, Delhi, he has a Post-GraduateDiploma in Management from IIM, Ahmedabad. As Managingdirector <strong>of</strong> Warburg Pincus, he is responsible for technologyand telecoms-related investments in South East Asia,Australia and India. Joined the board in November 2001.Sin Hang Boon, Non‐Executive Director. Nominatedby SingTel. Has a Post-Graduate Diploma in BusinessAdministration from the University <strong>of</strong> Singapore, and hasattended the Advanced Management Programme atHarvard. He has been a part <strong>of</strong> the top management<strong>of</strong> STI for 14 years, and is currently CEO. Joined theboard in December 2001.Wong Hung Khim, Independent Non‐Executive Director.Group chairman and CEO <strong>of</strong> the DelGro group <strong>of</strong> companies,Singapore. Has headed Singapore Port Authority and wasthe first president and CEO <strong>of</strong> SingTel. Joined the board inNovember 2001. He was awarded the meritorious servicemedal by SingTel in 1992.<strong>The</strong> <strong>Global</strong> <strong>Economic</strong> <strong>Impact</strong> <strong>of</strong> <strong>Private</strong> <strong>Equity</strong> <strong>Report</strong> <strong>2008</strong> Case studies: Warburg Pincus and Bharti Tele‐Ventures 163
- Page 2 and 3:
The Globalization of Alternative In
- Page 5:
ContributorsCo-editorsAnuradha Guru
- Page 9 and 10:
PrefaceKevin SteinbergChief Operati
- Page 11 and 12:
Letter on behalf of the Advisory Bo
- Page 13 and 14:
Executive summaryJosh lernerHarvard
- Page 15 and 16:
• Private equity-backed companies
- Page 17 and 18:
C. Indian casesThe two India cases,
- Page 19 and 20:
Part 1Large-sample studiesThe Globa
- Page 21 and 22:
The new demography of private equit
- Page 23 and 24:
among US publicly traded firms, it
- Page 25 and 26:
should be fairly complete. While th
- Page 27 and 28:
according to Moody’s (Hamilton et
- Page 29 and 30:
draining public markets of firms. I
- Page 31 and 32:
FIguresFigure 1A: LBO transactions
- Page 33 and 34:
TablesTable 1: Capital IQ 1980s cov
- Page 35 and 36:
Table 2: Magnitude and growth of LB
- Page 37 and 38:
Table 4: Exits of individual LBO tr
- Page 39 and 40:
Table 6: Determinants of exit succe
- Page 41 and 42:
Table 7: Ultimate staying power of
- Page 43 and 44:
Appendix 1: Imputed enterprise valu
- Page 45 and 46:
Private equity and long-run investm
- Page 47 and 48:
alternative names associated with t
- Page 49 and 50:
4. Finally, we explore whether firm
- Page 51 and 52:
When we estimate these regressions,
- Page 53 and 54:
cutting back on the number of filin
- Page 55 and 56:
Table 1: Summary statisticsPanel D:
- Page 57 and 58:
Table 4: Relative citation intensit
- Page 59 and 60:
figuresFigure 1: Number of private
- Page 61 and 62:
Private equity and employment*steve
- Page 63 and 64:
Especially when taken together, our
- Page 65 and 66:
centred on the transaction year ide
- Page 67 and 68:
and Vartia 1985.) Aggregate employm
- Page 69 and 70:
sectors. In Retail Trade, the cumul
- Page 71 and 72:
employment-weighted acquisition rat
- Page 73 and 74:
FIguresFigure 1: Matches of private
- Page 75 and 76:
Figure 6:Figure 6A: Comparison of n
- Page 77 and 78:
Figure 8:Figure 8A: Comparison of j
- Page 79 and 80:
Figure 11: Variation in impact in e
- Page 81 and 82:
Figure 12: Differences in impact on
- Page 83 and 84:
Private equity and corporate govern
- Page 85 and 86:
et al (2007) track the evolution of
- Page 87 and 88:
groups aim to improve firm performa
- Page 89 and 90:
distribution of the LBO sponsors, m
- Page 91 and 92:
the most difficult cases. This stor
- Page 93 and 94:
to see whether these changes of CEO
- Page 95 and 96:
Figure 3:This figure represents the
- Page 97 and 98:
TablesTable 1: Company size descrip
- Page 99 and 100:
Table 5: Changes in the board size,
- Page 101 and 102:
Table 7: Board turnoverPanel A: Siz
- Page 103 and 104:
Part 2Case studiesThe Global Econom
- Page 105 and 106:
European private equity cases: intr
- Page 107 and 108:
Exhibit 1: Private equity fund size
- Page 109 and 110:
Messer Griesheimann-kristin achleit
- Page 111 and 112:
ealized it was not possible to grow
- Page 113 and 114:
The deal with Allianz Capital partn
- Page 115 and 116:
the deal, the private equity invest
- Page 117 and 118:
Exhibit 1: The Messer Griesheim dea
- Page 119 and 120:
Exhibit 5: Post buyout structureMes
- Page 121 and 122:
New Lookann-kristin achleitnerTechn
- Page 123 and 124:
feet. This restricted store space w
- Page 125 and 126:
institutional investors why this in
- Page 127 and 128:
Although a public listing did not a
- Page 129 and 130: Exhibit 5: Employment development a
- Page 131 and 132: Chinese private equity cases: intro
- Page 133 and 134: Hony Capital and China Glass Holdin
- Page 135 and 136: Hony’s Chinese name means ambitio
- Page 137 and 138: Establishing early agreement on pos
- Page 139 and 140: Executing the IPOEach of the initia
- Page 141 and 142: Exhibit 1A: Summary of Hony Capital
- Page 143 and 144: Exhibit 4: Members of the China Gla
- Page 145 and 146: Exhibit 6A: China Glass post‐acqu
- Page 147 and 148: Exhibit 8: China Glass stock price
- Page 149 and 150: 3i Group plc and Little Sheep*Lily
- Page 151 and 152: y an aggressive franchise strategy,
- Page 153 and 154: soul” of the business. But there
- Page 155 and 156: Exhibit 1: Summary information on 3
- Page 157 and 158: Exhibit 6: An excerpt from the 180-
- Page 159 and 160: Indian private equity cases: introd
- Page 161 and 162: ICICI Venture and Subhiksha *Lily F
- Page 163 and 164: investment,” recalled Deshpande.
- Page 165 and 166: 2005 - 2007: Moderator, protector a
- Page 167 and 168: Exhibit 3: Subhiksha’s board comp
- Page 169 and 170: Warburg Pincus and Bharti Tele‐Ve
- Page 171 and 172: founded two companies at this time
- Page 173 and 174: By 2003 this restructuring task was
- Page 175 and 176: Exhibit 1C: Private equity investme
- Page 177 and 178: Exhibit 4B: Bharti cellular footpri
- Page 179: Exhibit 6: Summary of Bharti’s fi
- Page 183 and 184: In the 1993‐94 academic year, he
- Page 185 and 186: consumer products. She was also a R
- Page 187 and 188: AcknowledgementsJosh LernerHarvard
- Page 189: The World Economic Forum is an inde