

The Global Economic Impact of Private Equity Report 2008 - World ...
The Global Economic Impact of Private Equity Report 2008 - World ...
The Global Economic Impact of Private Equity Report 2008 - World ...
- No tags were found...

Create successful ePaper yourself
Turn your PDF publications into a flip-book with our unique Google optimized e-Paper software.
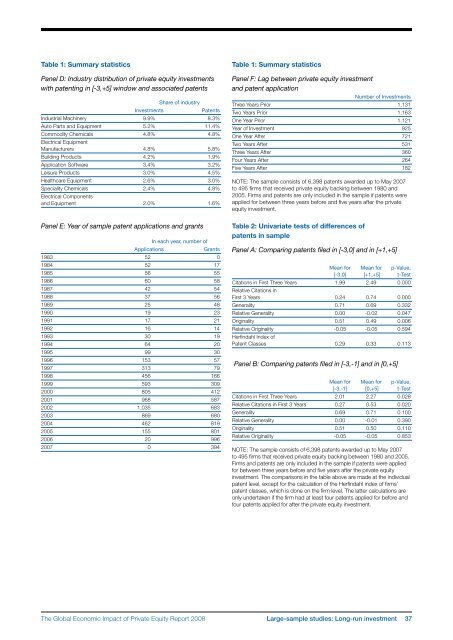
Table 1: Summary statisticsPanel D: Industry distribution <strong>of</strong> private equity investmentswith patenting in [-3,+5] window and associated patentsInvestmentsShare <strong>of</strong> industryPatentsIndustrial Machinery 9.9% 8.3%Auto Parts and Equipment 5.2% 11.4%Commodity Chemicals 4.8% 4.8%Electrical EquipmentManufacturers 4.8% 5.8%Building Products 4.2% 1.9%Application S<strong>of</strong>tware 3.4% 3.2%Leisure Products 3.0% 4.5%Healthcare Equipment 2.6% 3.0%Speciality Chemicals 2.4% 4.8%Electrical Componentsand Equipment 2.0% 1.6%Panel E: Year <strong>of</strong> sample patent applications and grantsApplicationsIn each year, number <strong>of</strong>Grants1983 52 01984 52 171985 56 551986 60 581987 42 541988 37 561989 25 481990 19 231991 17 211992 16 141993 30 191994 64 201995 99 301996 153 571997 313 791998 456 1661999 593 3092000 805 4122001 968 5872002 1,035 6832003 869 6802004 462 8192005 155 8012006 20 9962007 0 394Table 1: Summary statisticsPanel F: Lag between private equity investmentand patent applicationNumber <strong>of</strong> InvestmentsThree Years Prior 1,131Two Years Prior 1,163One Year Prior 1,121Year <strong>of</strong> Investment 925One Year After 721Two Years After 531Three Years After 360Four Years After 264Five Years After 182NOTE: <strong>The</strong> sample consists <strong>of</strong> 6,398 patents awarded up to May 2007to 495 firms that received private equity backing between 1980 and2005. Firms and patents are only included in the sample if patents wereapplied for between three years before and five years after the privateequity investment.Table 2: Univariate tests <strong>of</strong> differences <strong>of</strong>patents in samplePanel A: Comparing patents filed in [-3,0] and in [+1,+5]Mean for Mean for p-Value,[-3,0] [+1,+5] t-TestCitations in First Three Years 1.99 2.49 0.000Relative Citations inFirst 3 Years 0.24 0.74 0.000Generality 0.71 0.69 0.332Relative Generality 0.00 -0.02 0.047Originality 0.51 0.49 0.006Relative Originality ‐0.05 -0.05 0.594Herfindahl Index <strong>of</strong>Patent Classes 0.29 0.33 0.113Panel B: Comparing patents filed in [-3,-1] and in [0,+5]Mean for Mean for p-Value,[-3,-1] [0,+5] t-TestCitations in First Three Years 2.01 2.27 0.028Relative Citations in First 3 Years 0.27 0.53 0.020Generality 0.69 0.71 0.100Relative Generality 0.00 -0.01 0.390Originality 0.51 0.50 0.110Relative Originality ‐0.05 -0.05 0.853NOTE: <strong>The</strong> sample consists <strong>of</strong> 6,398 patents awarded up to May 2007to 495 firms that received private equity backing between 1980 and 2005.Firms and patents are only included in the sample if patents were appliedfor between three years before and five years after the private equityinvestment. <strong>The</strong> comparisons in the table above are made at the individualpatent level, except for the calculation <strong>of</strong> the Herfindahl index <strong>of</strong> firms’patent classes, which is done on the firm level. <strong>The</strong> latter calculations areonly undertaken if the firm had at least four patents applied for before andfour patents applied for after the private equity investment.<strong>The</strong> <strong>Global</strong> <strong>Economic</strong> <strong>Impact</strong> <strong>of</strong> <strong>Private</strong> <strong>Equity</strong> <strong>Report</strong> <strong>2008</strong> Large-sample studies: Long-run investment 37


