TablesTable 2: Magnitude and growth <strong>of</strong> LBO activityTable 2B: LBO transactions by regionNumber <strong>of</strong> dealsFinancial No financial % with All LBOsponsor sponsor sponsor transactions % <strong>of</strong> world totalN N N Whole period 1970-2000 2001-2007United States 8,031 1,628 83.1% 9,659 45.1% 55.1% 34.8%Canada 334 137 70.9% 471 2.2% 1.5% 3.5%Continental Europe 3,920 699 84.9% 4,619 21.6% 15.6% 17.6%Scandinavia 829 140 85.6% 969 4.5% 3.1% 3.6%United Kingdom 2,889 1,137 71.8% 4,026 18.8% 20.1% 28.7%Africa and Middle East 180 104 63.4% 284 1.3% 0.7% 2.8%Asia 398 110 78.3% 508 2.4% 1.5% 2.8%Australia 183 95 65.8% 278 1.3% 0.5% 2.5%Eastern Europe 296 93 76.1% 389 1.8% 1.1% 2.5%Latin America 143 51 73.7% 194 0.9% 0.8% 1.3%Total 17,203 4,194 80.4% 21,397Million USD (year 2007) amounts using imputed enterprise values (see Appendix I)Financial No financial % with All LBOsponsor sponsor sponsor transactions % <strong>of</strong> world total$ million $ million $ million Whole period 1970-2000 2001-2007United States 1,814,557 133,973 93.1% 1,948,530 49.7% 64.5% 42.8%Canada 76,448 4,980 93.9% 81,428 2.1% 1.5% 2.4%Continental Europe 819,626 44,587 94.8% 864,213 22.0% 13.2% 26.1%Scandinavia 128,298 20,324 86.3% 148,623 3.8% 2.3% 4.5%United Kingdom 539,385 62,247 89.7% 601,632 15.3% 15.0% 15.5%Africa and Middle East 24,777 13,328 65.0% 38,105 1.0% 0.3% 1.3%Asia 116,440 13,109 89.9% 129,549 3.3% 1.8% 4.0%Australia 36,070 2,365 93.8% 38,435 1.0% 0.3% 1.3%Eastern Europe 26,197 2,849 90.2% 29,045 0.7% 0.2% 1.0%Latin America 40,994 1,340 96.8% 42,334 1.1% 0.9% 1.2%Total 3,622,792 299,102 92.4% 3,921,894 100.0% 100.0% 100.0%16 Large-sample studies: Demography<strong>The</strong> <strong>Global</strong> <strong>Economic</strong> <strong>Impact</strong> <strong>of</strong> <strong>Private</strong> <strong>Equity</strong> <strong>Report</strong> <strong>2008</strong>
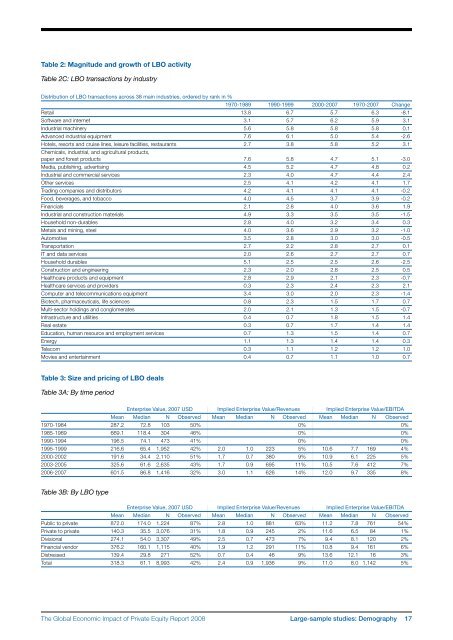
Table 2: Magnitude and growth <strong>of</strong> LBO activityTable 2C: LBO transactions by industryDistribution <strong>of</strong> LBO transactions across 38 main industries, ordered by rank in %1970-1989 1990-1999 2000-2007 1970-2007 ChangeRetail 13.8 6.7 5.7 6.3 -8.1S<strong>of</strong>tware and internet 3.1 5.7 6.2 5.9 3.1Industrial machinery 5.6 5.8 5.8 5.8 0.1Advanced industrial equipment 7.6 6.1 5.0 5.4 -2.6Hotels, resorts and cruise lines, leisure facilities, restaurants 2.7 3.8 5.8 5.2 3.1Chemicals, industrial, and agricultural products,paper and forest products 7.6 5.8 4.7 5.1 -3.0Media, publishing, advertising 4.5 5.2 4.7 4.8 0.2Industrial and commercial services 2.3 4.0 4.7 4.4 2.4Other services 2.5 4.1 4.2 4.1 1.7Trading companies and distributors 4.2 4.1 4.1 4.1 -0.2Food, beverages, and tobacco 4.0 4.5 3.7 3.9 -0.2Financials 2.1 2.8 4.0 3.6 1.9Industrial and construction materials 4.9 3.3 3.5 3.5 -1.5Household non-durables 2.8 4.0 3.2 3.4 0.3Metals and mining, steel 4.0 3.6 2.9 3.2 -1.0Automotive 3.5 2.8 3.0 3.0 -0.5Transportation 2.7 2.2 2.8 2.7 0.1IT and data services 2.0 2.6 2.7 2.7 0.7Household durables 5.1 2.5 2.5 2.6 -2.5Construction and engineering 2.3 2.0 2.8 2.5 0.5Healthcare products and equipment 2.8 2.9 2.1 2.3 -0.7Healthcare services and providers 0.3 2.3 2.4 2.3 2.1Computer and telecommunications equipment 3.4 3.0 2.0 2.3 -1.4Biotech, pharmaceuticals, life sciences 0.8 2.3 1.5 1.7 0.7Multi-sector holdings and conglomerates 2.0 2.1 1.3 1.5 -0.7Infrastructure and utilities 0.4 0.7 1.8 1.5 1.4Real estate 0.3 0.7 1.7 1.4 1.4Education, human resource and employment services 0.7 1.3 1.5 1.4 0.7Energy 1.1 1.3 1.4 1.4 0.3Telecom 0.3 1.1 1.2 1.2 1.0Movies and entertainment 0.4 0.7 1.1 1.0 0.7Table 3: Size and pricing <strong>of</strong> LBO dealsTable 3A: By time periodEnterprise Value, 2007 USD Implied Enterprise Value/Revenues Implied Enterprise Value/EBITDAMean Median N Observed Mean Median N Observed Mean Median N Observed1970-1984 287.2 72.8 103 50% 0% 0%1985-1989 669.1 118.4 304 46% 0% 0%1990-1994 196.5 74.1 473 41% 0% 0%1995-1999 216.6 65.4 1,952 42% 2.0 1.0 223 5% 10.6 7.7 169 4%2000-2002 191.6 34.4 2,110 51% 1.7 0.7 380 9% 10.9 6.1 225 5%2003-2005 325.6 61.6 2,635 43% 1.7 0.9 695 11% 10.5 7.6 412 7%2006-2007 601.5 86.8 1,416 32% 3.0 1.1 626 14% 12.0 9.7 335 8%Table 3B: By LBO typeEnterprise Value, 2007 USD Implied Enterprise Value/Revenues Implied Enterprise Value/EBITDAMean Median N Observed Mean Median N Observed Mean Median N ObservedPublic to private 872.0 174.0 1,224 87% 2.8 1.0 881 63% 11.2 7.8 761 54%<strong>Private</strong> to private 140.3 35.5 3,076 31% 1.8 0.9 245 2% 11.6 6.5 84 1%Divisional 274.1 54.0 3,307 49% 2.5 0.7 473 7% 9.4 8.1 120 2%Financial vendor 376.2 160.1 1,115 40% 1.9 1.2 291 11% 10.8 9.4 161 6%Distressed 139.4 29.8 271 52% 0.7 0.4 46 9% 13.6 12.1 16 3%Total 318.3 61.1 8,993 42% 2.4 0.9 1,936 9% 11.0 8.0 1,142 5%<strong>The</strong> <strong>Global</strong> <strong>Economic</strong> <strong>Impact</strong> <strong>of</strong> <strong>Private</strong> <strong>Equity</strong> <strong>Report</strong> <strong>2008</strong> Large-sample studies: Demography 17
- Page 2 and 3: The Globalization of Alternative In
- Page 5: ContributorsCo-editorsAnuradha Guru
- Page 9 and 10: PrefaceKevin SteinbergChief Operati
- Page 11 and 12: Letter on behalf of the Advisory Bo
- Page 13 and 14: Executive summaryJosh lernerHarvard
- Page 15 and 16: • Private equity-backed companies
- Page 17 and 18: C. Indian casesThe two India cases,
- Page 19 and 20: Part 1Large-sample studiesThe Globa
- Page 21 and 22: The new demography of private equit
- Page 23 and 24: among US publicly traded firms, it
- Page 25 and 26: should be fairly complete. While th
- Page 27 and 28: according to Moody’s (Hamilton et
- Page 29 and 30: draining public markets of firms. I
- Page 31 and 32: FIguresFigure 1A: LBO transactions
- Page 33: TablesTable 1: Capital IQ 1980s cov
- Page 37 and 38: Table 4: Exits of individual LBO tr
- Page 39 and 40: Table 6: Determinants of exit succe
- Page 41 and 42: Table 7: Ultimate staying power of
- Page 43 and 44: Appendix 1: Imputed enterprise valu
- Page 45 and 46: Private equity and long-run investm
- Page 47 and 48: alternative names associated with t
- Page 49 and 50: 4. Finally, we explore whether firm
- Page 51 and 52: When we estimate these regressions,
- Page 53 and 54: cutting back on the number of filin
- Page 55 and 56: Table 1: Summary statisticsPanel D:
- Page 57 and 58: Table 4: Relative citation intensit
- Page 59 and 60: figuresFigure 1: Number of private
- Page 61 and 62: Private equity and employment*steve
- Page 63 and 64: Especially when taken together, our
- Page 65 and 66: centred on the transaction year ide
- Page 67 and 68: and Vartia 1985.) Aggregate employm
- Page 69 and 70: sectors. In Retail Trade, the cumul
- Page 71 and 72: employment-weighted acquisition rat
- Page 73 and 74: FIguresFigure 1: Matches of private
- Page 75 and 76: Figure 6:Figure 6A: Comparison of n
- Page 77 and 78: Figure 8:Figure 8A: Comparison of j
- Page 79 and 80: Figure 11: Variation in impact in e
- Page 81 and 82: Figure 12: Differences in impact on
- Page 83 and 84: Private equity and corporate govern
- Page 85 and 86:
et al (2007) track the evolution of
- Page 87 and 88:
groups aim to improve firm performa
- Page 89 and 90:
distribution of the LBO sponsors, m
- Page 91 and 92:
the most difficult cases. This stor
- Page 93 and 94:
to see whether these changes of CEO
- Page 95 and 96:
Figure 3:This figure represents the
- Page 97 and 98:
TablesTable 1: Company size descrip
- Page 99 and 100:
Table 5: Changes in the board size,
- Page 101 and 102:
Table 7: Board turnoverPanel A: Siz
- Page 103 and 104:
Part 2Case studiesThe Global Econom
- Page 105 and 106:
European private equity cases: intr
- Page 107 and 108:
Exhibit 1: Private equity fund size
- Page 109 and 110:
Messer Griesheimann-kristin achleit
- Page 111 and 112:
ealized it was not possible to grow
- Page 113 and 114:
The deal with Allianz Capital partn
- Page 115 and 116:
the deal, the private equity invest
- Page 117 and 118:
Exhibit 1: The Messer Griesheim dea
- Page 119 and 120:
Exhibit 5: Post buyout structureMes
- Page 121 and 122:
New Lookann-kristin achleitnerTechn
- Page 123 and 124:
feet. This restricted store space w
- Page 125 and 126:
institutional investors why this in
- Page 127 and 128:
Although a public listing did not a
- Page 129 and 130:
Exhibit 5: Employment development a
- Page 131 and 132:
Chinese private equity cases: intro
- Page 133 and 134:
Hony Capital and China Glass Holdin
- Page 135 and 136:
Hony’s Chinese name means ambitio
- Page 137 and 138:
Establishing early agreement on pos
- Page 139 and 140:
Executing the IPOEach of the initia
- Page 141 and 142:
Exhibit 1A: Summary of Hony Capital
- Page 143 and 144:
Exhibit 4: Members of the China Gla
- Page 145 and 146:
Exhibit 6A: China Glass post‐acqu
- Page 147 and 148:
Exhibit 8: China Glass stock price
- Page 149 and 150:
3i Group plc and Little Sheep*Lily
- Page 151 and 152:
y an aggressive franchise strategy,
- Page 153 and 154:
soul” of the business. But there
- Page 155 and 156:
Exhibit 1: Summary information on 3
- Page 157 and 158:
Exhibit 6: An excerpt from the 180-
- Page 159 and 160:
Indian private equity cases: introd
- Page 161 and 162:
ICICI Venture and Subhiksha *Lily F
- Page 163 and 164:
investment,” recalled Deshpande.
- Page 165 and 166:
2005 - 2007: Moderator, protector a
- Page 167 and 168:
Exhibit 3: Subhiksha’s board comp
- Page 169 and 170:
Warburg Pincus and Bharti Tele‐Ve
- Page 171 and 172:
founded two companies at this time
- Page 173 and 174:
By 2003 this restructuring task was
- Page 175 and 176:
Exhibit 1C: Private equity investme
- Page 177 and 178:
Exhibit 4B: Bharti cellular footpri
- Page 179 and 180:
Exhibit 6: Summary of Bharti’s fi
- Page 181 and 182:
Exhibit 7: Bharti’s board structu
- Page 183 and 184:
In the 1993‐94 academic year, he
- Page 185 and 186:
consumer products. She was also a R
- Page 187 and 188:
AcknowledgementsJosh LernerHarvard
- Page 189:
The World Economic Forum is an inde