

The Global Economic Impact of Private Equity Report 2008 - World ...
The Global Economic Impact of Private Equity Report 2008 - World ...
The Global Economic Impact of Private Equity Report 2008 - World ...
- No tags were found...

Create successful ePaper yourself
Turn your PDF publications into a flip-book with our unique Google optimized e-Paper software.
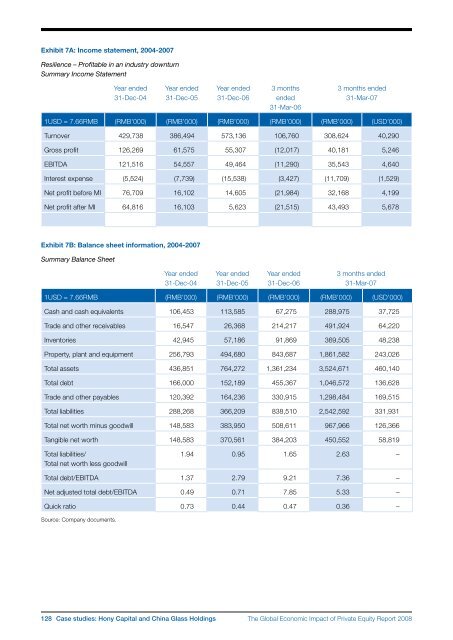
Exhibit 7A: Income statement, 2004-2007Resilience – Pr<strong>of</strong>itable in an industry downturnSummary Income StatementYear ended31-Dec-04Year ended31-Dec-05Year ended31-Dec-063 monthsended31-Mar-063 months ended31-Mar-071USD = 7.66RMB (RMB’000) (RMB’000) (RMB’000) (RMB’000) (RMB’000) (USD’000)Turnover 429,738 386,494 573,136 106,760 308,624 40,290Gross pr<strong>of</strong>it 126,269 61,575 55,307 (12,017) 40,181 5,246EBITDA 121,516 54,557 49,464 (11,290) 35,543 4,640Interest expense (5,524) (7,739) (15,538) (3,427) (11,709) (1,529)Net pr<strong>of</strong>it before MI 76,709 16,102 14,605 (21,984) 32,168 4,199Net pr<strong>of</strong>it after MI 64,816 16,103 5,623 (21,515) 43,493 5,678Exhibit 7B: Balance sheet information, 2004-2007Summary Balance SheetYear ended31-Dec-04Year ended31-Dec-05Year ended31-Dec-063 months ended31-Mar-071USD = 7.66RMB (RMB’000) (RMB’000) (RMB’000) (RMB’000) (USD’000)Cash and cash equivalents 106,453 113,585 67,275 288,975 37,725Trade and other receivables 16,547 26,368 214,217 491,924 64,220Inventories 42,945 57,186 91,869 369,505 48,238Property, plant and equipment 256,793 494,680 843,687 1,861,582 243,026Total assets 436,851 764,272 1,361,234 3,524,671 460,140Total debt 166,000 152,189 455,367 1,046,572 136,628Trade and other payables 120,392 164,236 330,915 1,298,484 169,515Total liabilities 288,268 366,209 838,510 2,542,592 331,931Total net worth minus goodwill 148,583 383,950 508,611 967,966 126,366Tangible net worth 148,583 370,561 384,203 450,552 58,819Total liabilities/Total net worth less goodwill1.94 0.95 1.65 2.63 –Total debt/EBITDA 1.37 2.79 9.21 7.36 –Net adjusted total debt/EBITDA 0.49 0.71 7.85 5.33 –Quick ratio 0.73 0.44 0.47 0.36 –Source: Company documents.128 Case studies: Hony Capital and China Glass Holdings<strong>The</strong> <strong>Global</strong> <strong>Economic</strong> <strong>Impact</strong> <strong>of</strong> <strong>Private</strong> <strong>Equity</strong> <strong>Report</strong> <strong>2008</strong>


