

The Global Economic Impact of Private Equity Report 2008 - World ...
The Global Economic Impact of Private Equity Report 2008 - World ...
The Global Economic Impact of Private Equity Report 2008 - World ...
- No tags were found...

Create successful ePaper yourself
Turn your PDF publications into a flip-book with our unique Google optimized e-Paper software.
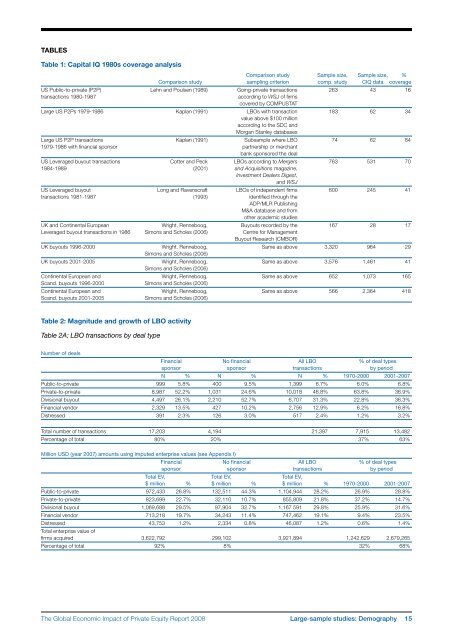
TablesTable 1: Capital IQ 1980s coverage analysisComparison study Sample size, Sample size, %Comparison study sampling criterion comp. study CIQ data coverageUS Public-to-private (P2P) Lehn and Poulsen (1989) Going-private transactions 263 43 16transactions 1980-1987according to WSJ <strong>of</strong> firmscovered by COMPUSTATLarge US P2Ps 1979-1986 Kaplan (1991) LBOs with transaction 183 62 34value above $100 millionaccording to the SDC andMorgan Stanley databasesLarge US P2P transactions Kaplan (1991) Subsample where LBO 74 62 841979-1986 with financial sponsor partnership or merchantbank sponsored the dealUS Leveraged buyout transactions Cotter and Peck LBOs according to Mergers 763 531 701984-1989 (2001) and Acquisitions magazine,Investment Dealers Digest,and WSJUS Leveraged buyout Long and Ravenscraft LBOs <strong>of</strong> independent firms 600 245 41transactions 1981-1987 (1993) identified through theADP/MLR PublishingM&A database and fromother academic studiesUK and Continental European Wright, Renneboog, Buyouts recorded by the 167 28 17Leveraged buyout transactions in 1986 Simons and Scholes (2006) Centre for ManagementBuyout Research (CMBOR)UK buyouts 1996-2000 Wright, Renneboog, Same as above 3,320 964 29Simons and Scholes (2006)UK buyouts 2001-2005 Wright, Renneboog, Same as above 3,576 1,461 41Simons and Scholes (2006)Continental European and Wright, Renneboog, Same as above 652 1,073 165Scand. buyouts 1996-2000 Simons and Scholes (2006)Continental European and Wright, Renneboog, Same as above 566 2,364 418Scand. buyouts 2001-2005 Simons and Scholes (2006)Table 2: Magnitude and growth <strong>of</strong> LBO activityTable 2A: LBO transactions by deal typeNumber <strong>of</strong> dealsFinancial No financial All LBO % <strong>of</strong> deal typessponsor sponsor transactions by periodN % N % N % 1970-2000 2001-2007Public-to-private 999 5.8% 400 9.5% 1,399 6.7% 6.0% 6.8%<strong>Private</strong>-to-private 8,987 52.2% 1,031 24.6% 10,018 46.8% 63.8% 36.9%Divisional buyout 4,497 26.1% 2,210 52.7% 6,707 31.3% 22.8% 36.3%Financial vendor 2,329 13.5% 427 10.2% 2,756 12.9% 6.2% 16.8%Distressed 391 2.3% 126 3.0% 517 2.4% 1.2% 3.2%Total number <strong>of</strong> transactions 17,203 4,194 21,397 7,915 13,482Percentage <strong>of</strong> total 80% 20% 37% 63%Million USD (year 2007) amounts using imputed enterprise values (see Appendix I)Financial No financial All LBO % <strong>of</strong> deal typessponsor sponsor transactions by periodTotal EV, Total EV, Total EV,$ million % $ million % $ million % 1970-2000 2001-2007Public-to-private 972,433 26.8% 132,511 44.3% 1,104,944 28.2% 26.9% 28.8%<strong>Private</strong>-to-private 823,699 22.7% 32,110 10.7% 855,809 21.8% 37.2% 14.7%Divisional buyout 1,069,688 29.5% 97,904 32.7% 1,167 591 29.8% 25.9% 31.6%Financial vendor 713,218 19.7% 34,243 11.4% 747,462 19.1% 9.4% 23.5%Distressed 43,753 1.2% 2,334 0.8% 46,087 1.2% 0.6% 1.4%Total enterprise value <strong>of</strong>firms acquired 3,622,792 299,102 3,921,894 1,242,629 2,679,265Percentage <strong>of</strong> total 92% 8% 32% 68%<strong>The</strong> <strong>Global</strong> <strong>Economic</strong> <strong>Impact</strong> <strong>of</strong> <strong>Private</strong> <strong>Equity</strong> <strong>Report</strong> <strong>2008</strong> Large-sample studies: Demography 15


