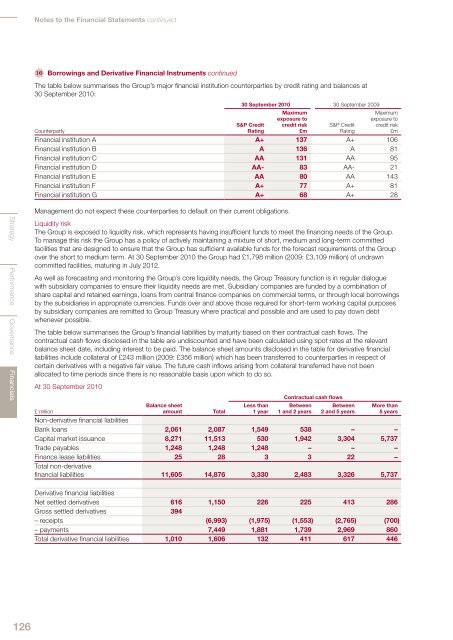
Notes to the Financial Statements continued16 Borrowings and Derivative Financial Instruments continuedThe table below summarises the <strong>Group</strong>’s major financial institution counterparties by credit rating and balances at30 September <strong>2010</strong>:30 September <strong>2010</strong> 30 September 2009S&P CreditRatingMaximumexposure tocredit risk£mS&P CreditRatingMaximumexposure tocredit risk£mCounterpartyFinancial institution A A+ 137 A+ 106Financial institution B A 136 A 81Financial institution C AA 131 AA 95Financial institution D AA- 83 AA- 21Financial institution E AA 80 AA 143Financial institution F A+ 77 A+ 81Financial institution G A+ 68 A+ 28Strategy Performance Governance FinancialsManagement do not expect these counterparties to default on their current obligations.Liquidity riskThe <strong>Group</strong> is exposed to liquidity risk, which represents having insufficient funds to meet the financing needs of the <strong>Group</strong>.To manage this risk the <strong>Group</strong> has a policy of actively maintaining a mixture of short, medium and long-term committedfacilities that are designed to ensure that the <strong>Group</strong> has sufficient available funds for the forecast requirements of the <strong>Group</strong>over the short to medium term. At 30 September <strong>2010</strong> the <strong>Group</strong> had £1,798 million (2009: £3,109 million) of undrawncommitted facilities, maturing in July 2012.As well as forecasting and monitoring the <strong>Group</strong>’s core liquidity needs, the <strong>Group</strong> Treasury function is in regular dialoguewith subsidiary companies to ensure their liquidity needs are met. Subsidiary companies are funded by a combination ofshare capital and retained earnings, loans from central finance companies on commercial terms, or through local borrowingsby the subsidiaries in appropriate currencies. Funds over and above those required for short-term working capital purposesby subsidiary companies are remitted to <strong>Group</strong> Treasury where practical and possible and are used to pay down debtwhenever possible.The table below summarises the <strong>Group</strong>’s financial liabilities by maturity based on their contractual cash flows. Thecontractual cash flows disclosed in the table are undiscounted and have been calculated using spot rates at the relevantbalance sheet date, including interest to be paid. The balance sheet amounts disclosed in the table for derivative financialliabilities include collateral of £243 million (2009: £356 million) which has been transferred to counterparties in respect ofcertain derivatives with a negative fair value. The future cash inflows arising from collateral transferred have not beenallocated to time periods since there is no reasonable basis upon which to do so.At 30 September <strong>2010</strong>Contractual cash flowsBalance sheetamountLess than1 yearBetween1 and 2 yearsBetween2 and 5 yearsMore than5 years£ millionTotalNon-derivative financial liabilitiesBank loans 2,061 2,087 1,549 538 – –Capital market issuance 8,271 11,513 530 1,942 3,304 5,737Trade payables 1,248 1,248 1,248 – – –Finance lease liabilities 25 28 3 3 22 –Total non-derivativefinancial liabilities 11,605 14,876 3,330 2,483 3,326 5,737Derivative financial liabilitiesNet settled derivatives 616 1,150 226 225 413 286Gross settled derivatives 394– receipts (6,993) (1,975) (1,553) (2,765) (700)– payments 7,449 1,881 1,739 2,969 860Total derivative financial liabilities 1,010 1,606 132 411 617 446126
At 30 September 2009Balance sheetamountLess than1 yearContractual cash flowsBetween1 and 2 yearsBetween2 and 5 yearsMore than5 years£ millionTotalNon-derivative financial liabilitiesBank loans 3,517 3,580 3,001 39 540 –Capital market issuance 8,550 12,803 546 546 5,212 6,499Trade payables 1,247 1,247 1,247 – – –Finance lease liabilities 28 33 3 3 27 –Total non-derivativefinancial liabilities 13,342 17,663 4,797 588 5,779 6,499Derivative financial liabilitiesNet settled derivatives 587 836 202 191 382 61Gross settled derivatives 730– receipts (8,524) (2,308) (1,037) (3,391) (1,788)– payments 9,387 2,284 1,109 3,871 2,123Total derivative financial liabilities 1,317 1,699 178 263 862 396Price riskThe <strong>Group</strong> is not exposed to equity securities price risk or financial instrument price risk other than its pension assetsdisclosed in note 18. The <strong>Group</strong> is exposed to commodity price risk in that there may be fluctuations in the price oftobacco leaf. As with other agricultural commodities, the price of tobacco leaf tends to be cyclical as supply and demandconsiderations influence tobacco plantings in those countries where tobacco is grown. Also, different regions mayexperience variations in weather patterns that may affect crop quality or supply and so lead to changes in price. The <strong>Group</strong>seeks to reduce this price risk by sourcing tobacco leaf from a number of different countries and counterparties and byvarying the levels of tobacco leaf held.Capital risk managementThe <strong>Group</strong> manages the capital structure in an efficient manner in order to minimise the cost of capital whilst ensuring thatwe have access to ongoing sources of finance such as the debt capital markets. The <strong>Group</strong> defines capital as adjusted netdebt (see note 26) and equity attributable to equity holders of the Company (see Consolidated Statement of Changes inEquity). The only externally imposed capital requirements for the <strong>Group</strong> are interest cover and gearing covenants under theterms of the Senior Bank Facility, with which we have fully complied during both the current period and the prior period.The <strong>Group</strong> manages the capital structure to maintain an investment grade credit rating and has and will continue to take theappropriate measures to maintain this. For example, where new equity is needed, the <strong>Group</strong> will issue the minimum requiredin order to maintain an investment grade credit rating. This is determined in connection with detailed discussions with creditrating agencies prior to raising new equity.Fair value estimationThe fair values of financial assets and liabilities with maturities less than one year, other than derivatives, are considered to beapproximate to their book values. In accordance with the IFRS 7 classification hierarchy all derivative financial instruments areclassified as Level 2. This means that they are valued using techniques based significantly on observable market data suchas yield curves and foreign exchange rates.127
- Page 1 and 2:
Imperial Tobacco Group PLCAnnual Re
- Page 3 and 4:
…to deliver sustainableshareholde
- Page 5 and 6:
Operational HighlightsDelivering Su
- Page 7 and 8:
and product portfolio to evolving c
- Page 9 and 10:
In this section9 Strategic Review10
- Page 11 and 12:
Our StrategyWe are focused on deliv
- Page 13 and 14:
Total Tobacco5 % Our Powerful Brand
- Page 15 and 16:
Our global strategic cigarette bran
- Page 17 and 18:
Our global team is fully aligned be
- Page 19 and 20:
Satisfying consumers and aligning o
- Page 21 and 22:
We are a responsive business with s
- Page 23 and 24:
Operating responsibly, combined wit
- Page 25 and 26:
Our growth drivers of sales growth,
- Page 27 and 28:
Principal Risks and UncertaintiesA
- Page 29 and 30:
Competition LawOverviewWe take comp
- Page 31 and 32:
Reconciliation of Adjusted Performa
- Page 33 and 34:
Key Performance Indicators (KPIs) 1
- Page 35 and 36:
Lambert & Butler and Richmond remai
- Page 37 and 38:
Within this the travel retail marke
- Page 39 and 40:
OutlookThe strength of our portfoli
- Page 41 and 42:
Blondes. In the Middle East, we aga
- Page 43 and 44:
Corporate ResponsibilityOur Corpora
- Page 45 and 46:
Corporate Responsibility and our St
- Page 47 and 48:
We have revised our IMS and employe
- Page 49 and 50:
Environmental Performance 1Absolute
- Page 51 and 52:
across the business. More informati
- Page 53 and 54:
Supplier RelationshipsOur main supp
- Page 55 and 56:
Non-financial performance indicator
- Page 57 and 58:
“High standards of corporategover
- Page 59 and 60:
5. Pierre Jungels, CBE (HON), PHD,
- Page 61 and 62:
Management and Corporate StructureB
- Page 63 and 64:
Meetings of the Board, Board Commit
- Page 65 and 66:
and supplemented by our Non-Executi
- Page 67 and 68:
6 Performance evaluation: How do we
- Page 69 and 70:
The Board recognises that we operat
- Page 71 and 72:
Assurance process for financial rep
- Page 73 and 74:
- receiving reports from, and quest
- Page 75 and 76:
Directors’ Report: Other Informat
- Page 77 and 78: - state whether IFRSs as adopted by
- Page 79 and 80: We understand that a purported coll
- Page 81 and 82: This Report covers the following:1
- Page 83 and 84: 2 Directors’ Emoluments for the Y
- Page 85 and 86: Directors’ Interests in Ordinary
- Page 87 and 88: Executive Directors’ Service Agre
- Page 89 and 90: When setting base salary the Remune
- Page 91 and 92: First ElementFifty per cent of the
- Page 93 and 94: In respect of the October 2007 - Oc
- Page 95 and 96: Any annual bonus earned up to 100 p
- Page 97 and 98: Benefit Trusts have also been provi
- Page 99 and 100: Independent Auditors’ Reportto th
- Page 101 and 102: Consolidated Statement ofComprehens
- Page 103 and 104: Consolidated Statement of Changes i
- Page 105 and 106: Accounting PoliciesBasis of Prepara
- Page 107 and 108: Duty and Similar ItemsDuty and simi
- Page 109 and 110: InventoriesInventories are stated a
- Page 111 and 112: Restructuring CostsSignificant one-
- Page 113 and 114: Property, Plant and Equipment and I
- Page 115 and 116: Tobacco net revenue£ million 2010
- Page 117 and 118: 3 Restructuring Costs£ million 201
- Page 119 and 120: Factors affecting the tax charge fo
- Page 121 and 122: 9 Intangible Assets2010£ million G
- Page 123 and 124: 10 Property, Plant and Equipment201
- Page 125 and 126: 13 Trade and Other Receivables2010
- Page 127: Sensitivity analysisIFRS 7 requires
- Page 131 and 132: (iii) Currency analysis and effecti
- Page 133 and 134: (iv) Derivative financial instrumen
- Page 135 and 136: Matures in financial year ending in
- Page 137 and 138: The following tables are provided i
- Page 139 and 140: Matures in financial year ending in
- Page 141 and 142: (vi) Hedge of net investments in fo
- Page 143 and 144: 18 Retirement Benefit SchemesThe Gr
- Page 145 and 146: Assumptions regarding future mortal
- Page 147 and 148: 21 Share SchemesThe Group recognise
- Page 149 and 150: Year from 1 October 2008 to 30 Sept
- Page 151 and 152: 23 CommitmentsCapital commitments£
- Page 153 and 154: 27 Reconciliation of Cash Flow to M
- Page 155 and 156: Imperial Tobacco Group PLC Balance
- Page 157 and 158: (iii) Debtors: Amounts Falling Due
- Page 159 and 160: Principal SubsidiariesThe principal
- Page 161 and 162: Shareholder InformationRegistered O
- Page 163 and 164: IndexAAccounting Policies 103Acquis