Annual report 2010 - Imperial Tobacco Group
Annual report 2010 - Imperial Tobacco Group
Annual report 2010 - Imperial Tobacco Group

You also want an ePaper? Increase the reach of your titles
YUMPU automatically turns print PDFs into web optimized ePapers that Google loves.
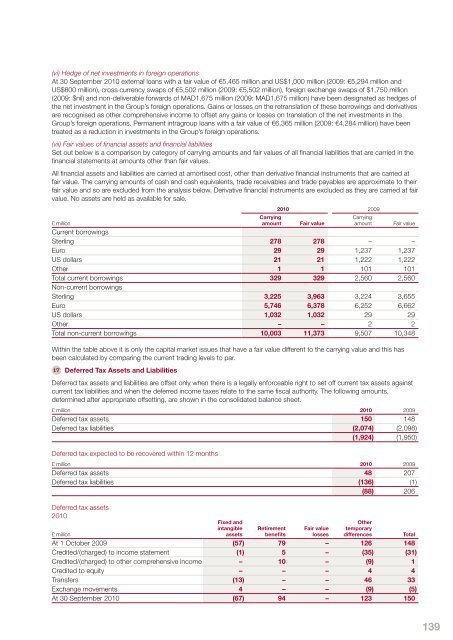
(vi) Hedge of net investments in foreign operationsAt 30 September <strong>2010</strong> external loans with a fair value of €5,465 million and US$1,000 million (2009: €5,294 million andUS$800 million), cross currency swaps of €5,502 million (2009: €5,502 million), foreign exchange swaps of $1,750 million(2009: $nil) and non-deliverable forwards of MAD1,675 million (2009: MAD1,675 million) have been designated as hedges ofthe net investment in the <strong>Group</strong>’s foreign operations. Gains or losses on the retranslation of these borrowings and derivativesare recognised as other comprehensive income to offset any gains or losses on translation of the net investments in the<strong>Group</strong>’s foreign operations. Permanent intragroup loans with a fair value of €6,365 million (2009: €4,284 million) have beentreated as a reduction in investments in the <strong>Group</strong>’s foreign operations.(vii) Fair values of financial assets and financial liabilitiesSet out below is a comparison by category of carrying amounts and fair values of all financial liabilities that are carried in thefinancial statements at amounts other than fair values.All financial assets and liabilities are carried at amortised cost, other than derivative financial instruments that are carried atfair value. The carrying amounts of cash and cash equivalents, trade receivables and trade payables are approximate to theirfair value and so are excluded from the analysis below. Derivative financial instruments are excluded as they are carried at fairvalue. No assets are held as available for sale.Carryingamount<strong>2010</strong> 2009Carryingamount£ millionFair valueFair valueCurrent borrowingsSterling 278 278 – –Euro 29 29 1,237 1,237US dollars 21 21 1,222 1,222Other 1 1 101 101Total current borrowings 329 329 2,560 2,560Non-current borrowingsSterling 3,225 3,963 3,224 3,655Euro 5,746 6,378 6,252 6,662US dollars 1,032 1,032 29 29Other – – 2 2Total non-current borrowings 10,003 11,373 9,507 10,348Within the table above it is only the capital market issues that have a fair value different to the carrying value and this hasbeen calculated by comparing the current trading levels to par.17 Deferred Tax Assets and LiabilitiesDeferred tax assets and liabilities are offset only when there is a legally enforceable right to set off current tax assets againstcurrent tax liabilities and when the deferred income taxes relate to the same fiscal authority. The following amounts,determined after appropriate offsetting, are shown in the consolidated balance sheet.£ million <strong>2010</strong> 2009Deferred tax assets 150 148Deferred tax liabilities (2,074) (2,098)(1,924) (1,950)Deferred tax expected to be recovered within 12 months£ million <strong>2010</strong> 2009Deferred tax assets 48 207Deferred tax liabilities (136) (1)(88) 206Deferred tax assets<strong>2010</strong>Fixed andintangibleassetsRetirementbenefitsFair valuelossesOthertemporarydifferences£ millionTotalAt 1 October 2009 (57) 79 – 126 148Credited/(charged) to income statement (1) 5 – (35) (31)Credited/(charged) to other comprehensive income – 10 – (9) 1Credited to equity – – – 4 4Transfers (13) – – 46 33Exchange movements 4 – – (9) (5)At 30 September <strong>2010</strong> (67) 94 – 123 150139