Annual report 2010 - Imperial Tobacco Group
Annual report 2010 - Imperial Tobacco Group
Annual report 2010 - Imperial Tobacco Group
You also want an ePaper? Increase the reach of your titles
YUMPU automatically turns print PDFs into web optimized ePapers that Google loves.
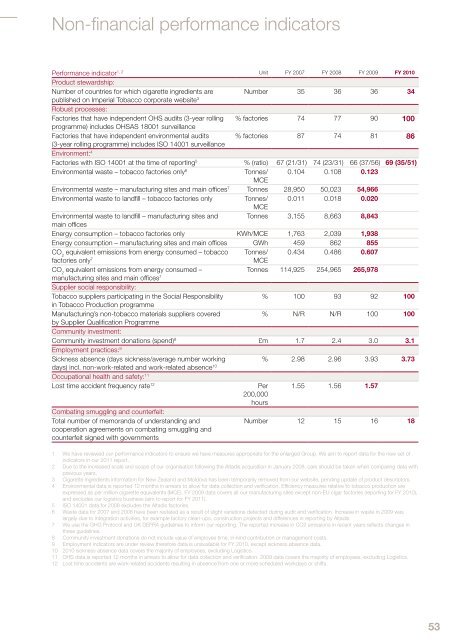
Non-financial performance indicatorsPerformance indicator 1, 2 Unit FY 2007 FY 2008 FY 2009 FY <strong>2010</strong>Product stewardship:Number of countries for which cigarette ingredients are Number 35 36 36 34published on <strong>Imperial</strong> <strong>Tobacco</strong> corporate website 3Robust processes:Factories that have independent OHS audits (3-year rolling % factories 74 77 90 100programme) includes OHSAS 18001 surveillanceFactories that have independent environmental audits % factories 87 74 81 86(3-year rolling programme) includes ISO 14001 surveillanceEnvironment: 4Factories with ISO 14001 at the time of <strong>report</strong>ing 5 % (ratio) 67 (21/31) 74 (23/31) 66 (37/56) 69 (35/51)Environmental waste – tobacco factories only 6Tonnes/ 0.104 0.108 0.123MCEEnvironmental waste – manufacturing sites and main offices 7 Tonnes 28,950 50,023 54,966Environmental waste to landfill – tobacco factories only Tonnes/ 0.011 0.018 0.020MCEEnvironmental waste to landfill – manufacturing sites and Tonnes 3,155 8,663 8,843main officesEnergy consumption – tobacco factories only KWh/MCE 1,763 2,039 1,938Energy consumption – manufacturing sites and main offices GWh 459 862 855CO 2equivalent emissions from energy consumed – tobacco Tonnes/ 0.434 0.486 0.607factories only 7MCECO 2equivalent emissions from energy consumed –Tonnes 114,925 254,965 265,978manufacturing sites and main offices 7Supplier social responsibility:<strong>Tobacco</strong> suppliers participating in the Social Responsibility% 100 93 92 100in <strong>Tobacco</strong> Production programmeManufacturing’s non-tobacco materials suppliers covered% N/R N/R 100 100by Supplier Qualification ProgrammeCommunity investment:Community investment donations (spend) 8 £m 1.7 2.4 3.0 3.1Employment practices: 9Sickness absence (days sickness/average number working% 2.98 2.96 3.93 3.73days) incl. non-work-related and work-related absence 10Occupational health and safety: 11Lost time accident frequency rate 12Per 1.55 1.56 1.57200,000hoursCombating smuggling and counterfeit:Total number of memoranda of understanding andcooperation agreements on combating smuggling andcounterfeit signed with governmentsNumber 12 15 16 181 We have reviewed our performance indicators to ensure we have measures appropriate for the enlarged <strong>Group</strong>. We aim to <strong>report</strong> data for the new set ofindicators in our 2011 <strong>report</strong>.2 Due to the increased scale and scope of our organisation following the Altadis acquisition in January 2008, care should be taken when comparing data withprevious years.3 Cigarette ingredients information for New Zealand and Moldova has been temporarily removed from our website, pending update of product descriptors.4 Environmental data is <strong>report</strong>ed 12 months in arrears to allow for data collection and verification. Efficiency measures relative to tobacco production areexpressed as per million cigarette equivalents (MCE). FY 2009 data covers all our manufacturing sites except non-EU cigar factories (<strong>report</strong>ing for FY <strong>2010</strong>),and excludes our logistics business (aim to <strong>report</strong> for FY 2011).5 ISO 14001 data for 2008 excludes the Altadis factories.6 Waste data for 2007 and 2008 have been restated as a result of slight variations detected during audit and verification. Increase in waste in 2009 waslargely due to integration activities, for example factory clean-ups, construction projects and differences in <strong>report</strong>ing by Altadis.7 We use the GHG Protocol and UK DEFRA guidelines to inform our <strong>report</strong>ing. The <strong>report</strong>ed increase in CO2 emissions in recent years reflects changes inthese guidelines.8 Community investment donations do not include value of employee time, in-kind contribution or management costs.9 Employment indicators are under review therefore data is unavailable for FY <strong>2010</strong>, except sickness absence data.10 <strong>2010</strong> sickness absence data covers the majority of employees, excluding Logistics.11 OHS data is <strong>report</strong>ed 12 months in arrears to allow for data collection and verification. 2009 data covers the majority of employees, excluding Logistics.12 Lost time accidents are work-related accidents resulting in absence from one or more scheduled workdays or shifts.53


