Annual report 2010 - Imperial Tobacco Group
Annual report 2010 - Imperial Tobacco Group
Annual report 2010 - Imperial Tobacco Group

Create successful ePaper yourself
Turn your PDF publications into a flip-book with our unique Google optimized e-Paper software.
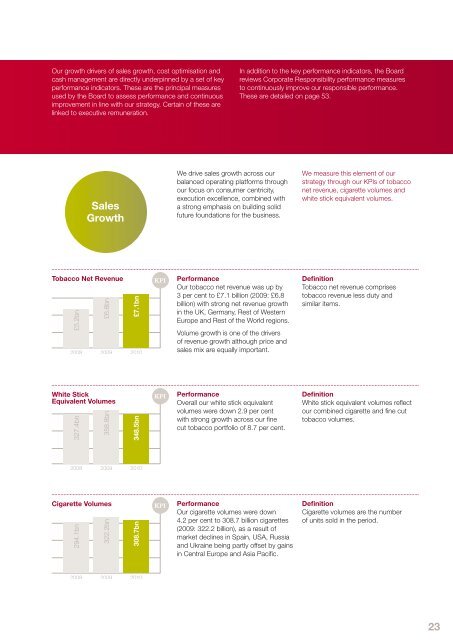
Our growth drivers of sales growth, cost optimisation andcash management are directly underpinned by a set of keyperformance indicators. These are the principal measuresused by the Board to assess performance and continuousimprovement in line with our strategy. Certain of these arelinked to executive remuneration.In addition to the key performance indicators, the Boardreviews Corporate Responsibility performance measuresto continuously improve our responsible performance.These are detailed on page 53.SalesGrowthWe drive sales growth across ourbalanced operating platforms throughour focus on consumer centricity,execution excellence, combined witha strong emphasis on building solidfuture foundations for the business.We measure this element of ourstrategy through our KPIs of tobacconet revenue, cigarette volumes andwhite stick equivalent volumes.<strong>Tobacco</strong> Net Revenue£5.2bn£6.8bn2008 2009£7.1bn<strong>2010</strong>KPIPerformanceOur tobacco net revenue was up by3 per cent to £7.1 billion (2009: £6.8billion) with strong net revenue growthin the UK, Germany, Rest of WesternEurope and Rest of the World regions.Volume growth is one of the driversof revenue growth although price andsales mix are equally important.Definition<strong>Tobacco</strong> net revenue comprisestobacco revenue less duty andsimilar items.White StickEquivalent Volumes327.4bn358.8bn348.5bnKPIPerformanceOverall our white stick equivalentvolumes were down 2.9 per centwith strong growth across our finecut tobacco portfolio of 8.7 per cent.DefinitionWhite stick equivalent volumes reflectour combined cigarette and fine cuttobacco volumes.20082009<strong>2010</strong>Cigarette Volumes294.1bn322.2bn308.7bnKPIPerformanceOur cigarette volumes were down4.2 per cent to 308.7 billion cigarettes(2009: 322.2 billion), as a result ofmarket declines in Spain, USA, Russiaand Ukraine being partly offset by gainsin Central Europe and Asia Pacific.DefinitionCigarette volumes are the numberof units sold in the period.20082009<strong>2010</strong>23