Financial Review continuedGeographic Analysis of <strong>Tobacco</strong>Net revenueAdjustedoperating profitCigarettevolumes (bn)Fine cut tobaccovolumes (tonnes)£ million <strong>2010</strong> 2009 <strong>2010</strong> 2009 <strong>2010</strong> 2009 <strong>2010</strong> 2009UK 911 893 614 601 21.1 20.8 2,800 2,650Germany 853 826 432 403 23.2 23.9 5,900 5,550Spain 594 610 268 275 25.3 30.3 1,400 2,350Rest of EU 1,577 1,490 638 566 59.6 59.3 15,000 12,650Americas 780 861 244 288 11.9 13.8 300 650Rest of the World 2,340 2,138 693 617 167.6 174.1 2,150 2,100Total 7,055 6,818 2,889 2,750 308.7 322.2 27,550 25,950Strategy Performance Governance FinancialsNet revenue in Spain declined by 3 per cent to £594 millionreflecting challenging market conditions and lower cigaretteand fine cut tobacco volumes. Adjusted operating profitdeclined by £7 million to £268 million. Excluding the impactof foreign exchange, profits were stable benefiting from priceincreases and cost synergies.In the Rest of EU, we delivered good performances in anumber of markets in the region with price increases andexcellent growth in our fine cut tobacco volumes increasingnet revenue by 6 per cent and adjusted operating profit by13 per cent.In the Americas, net revenue decreased by 9 per cent to£780 million, and adjusted operating profit declined by 15per cent to £244 million reflecting cigarette and cigar marketvolume declines following substantial increases in federalexcise tax last year, and a highly competitive market.In the Rest of the World, though cigarette volumes weredown in Eastern Europe, we performed well in Asia-Pacific,Africa and the Middle East, benefiting from strong pricingand a favourable sales mix. We grew revenue by 9 per centto £2,340 million and adjusted operating profit by 12 percent to £693 million.Restructuring and Synergies<strong>Tobacco</strong> profits benefited from incremental synergies from theAltadis acquisition of €110 million delivered during the year.Our cumulative synergies to date are in line with the scheduleoutlined at the time of the acquisition at €300 million.Included within restructuring costs are impairments ofsurplus properties mainly in Spain and the USA amountingto £45 million, reflecting current property market conditionsin these countries.Logistics£ million (unless otherwise stated) <strong>2010</strong> 2009Distribution fees 936 964Adjusted operating profit 176 177Adjusted distribution margin 18.8% 18.4%Against a difficult operating environment, particularly in Spain,our logistics business produced a good result with adjustedoperating profit in line with last year at £176 million and anincrease in adjusted distribution margin despite the impactof our initial investment in the Spanish lottery joint-venture.Net Finance CostsAdjusted net finance costs were £600 million (2009:£700 million). On an adjusted basis, our interest coverwas 5.1 times (2009: 4.2 times). Reported net financecosts of £410 million (2009: £1,392 million) include postemploymentbenefits net finance expense of £20 million(2009: £32 million) and fair value gains on derivative financialinstruments providing commercial hedges of £210 million(2009: losses of £660 million).TaxationThe adjusted tax charge for the period was £637 million(2009: £581 million) representing an adjusted effective taxrate of 25.8 per cent (2009: 26.0 per cent). The <strong>report</strong>edtax charge was £596 million (2009: £268 million).Foreign Exchange<strong>Tobacco</strong> net revenue benefited by £33 million due to currencyeffects, mainly as a result of the appreciation of the Australiandollar against sterling. Logistics distribution fees were reducedby £3 million as a result of currency effects. While averageUS dollar and euro rates were similar to last year, the foreignexchange effect of the time lag between the purchasing andconsumption of tobacco was the most significant factor inan overall reduction in <strong>Group</strong> adjusted operating profit dueto currency effects of £44 million.DividendsThe total amount of dividends payable in respect of <strong>2010</strong>is £885 million, an increase of 15 per cent on last year,which reflects growth in our adjusted attributable earningsto just over £1.8 billion. We have proposed a final dividendof 60.0 pence per share such that the total dividend forthe year is 84.3 pence. Following approval by shareholdersthis dividend will be paid on 18 February 2011 with anex dividend date of 19 January 2011.Cash Flow and FinancingAt the end of September <strong>2010</strong>, we had committed financingfacilities in place of around £12 billion. Some 30 per centwas bank facilities with the balance raised through capitalmarket bond issues. We remain fully compliant with all ourbanking covenants and are committed to retaining ourinvestment grade credit ratings.30
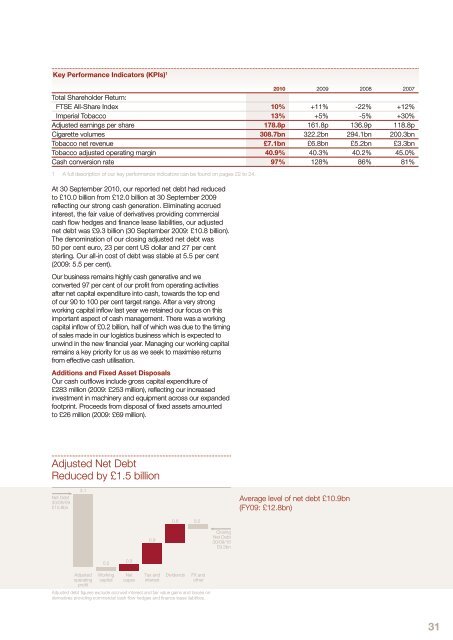
Key Performance Indicators (KPIs) 1 <strong>2010</strong> 2009 2008 2007Total Shareholder Return:FTSE All-Share Index 10% +11% -22% +12%<strong>Imperial</strong> <strong>Tobacco</strong> 13% +5% -5% +30%Adjusted earnings per share 178.8p 161.8p 136.9p 118.8pCigarette volumes 308.7bn 322.2bn 294.1bn 200.3bn<strong>Tobacco</strong> net revenue £7.1bn £6.8bn £5.2bn £3.3bn<strong>Tobacco</strong> adjusted operating margin 40.9% 40.3% 40.2% 45.0%Cash conversion rate 97% 128% 86% 81%1 A full description of our key performance indicators can be found on pages 22 to 24.At 30 September <strong>2010</strong>, our <strong>report</strong>ed net debt had reducedto £10.0 billion from £12.0 billion at 30 September 2009reflecting our strong cash generation. Eliminating accruedinterest, the fair value of derivatives providing commercialcash flow hedges and finance lease liabilities, our adjustednet debt was £9.3 billion (30 September 2009: £10.8 billion).The denomination of our closing adjusted net debt was50 per cent euro, 23 per cent US dollar and 27 per centsterling. Our all-in cost of debt was stable at 5.5 per cent(2009: 5.5 per cent).Our business remains highly cash generative and weconverted 97 per cent of our profit from operating activitiesafter net capital expenditure into cash, towards the top endof our 90 to 100 per cent target range. After a very strongworking capital inflow last year we retained our focus on thisimportant aspect of cash management. There was a workingcapital inflow of £0.2 billion, half of which was due to the timingof sales made in our logistics business which is expected tounwind in the new financial year. Managing our working capitalremains a key priority for us as we seek to maximise returnsfrom effective cash utilisation.Additions and Fixed Asset DisposalsOur cash outflows include gross capital expenditure of£283 million (2009: £253 million), reflecting our increasedinvestment in machinery and equipment across our expandedfootprint. Proceeds from disposal of fixed assets amountedto £26 million (2009: £69 million).Adjusted Net DebtReduced by £1.5 billionNet Debt30/09/09£10.8bn3.1Average level of net debt £10.9bn(FY09: £12.8bn)0.8 0.20.9ClosingNet Debt30/09/10£9.3bn0.20.3AdjustedoperatingprofitWorkingcapitalNetcapexTax andinterestDividendsFX andotherAdjusted debt figures exclude accrued interest and fair value gains and losses onderivatives providing commercial cash flow hedges and finance lease liabilities.31
- Page 1 and 2: Imperial Tobacco Group PLCAnnual Re
- Page 3 and 4: …to deliver sustainableshareholde
- Page 5 and 6: Operational HighlightsDelivering Su
- Page 7 and 8: and product portfolio to evolving c
- Page 9 and 10: In this section9 Strategic Review10
- Page 11 and 12: Our StrategyWe are focused on deliv
- Page 13 and 14: Total Tobacco5 % Our Powerful Brand
- Page 15 and 16: Our global strategic cigarette bran
- Page 17 and 18: Our global team is fully aligned be
- Page 19 and 20: Satisfying consumers and aligning o
- Page 21 and 22: We are a responsive business with s
- Page 23 and 24: Operating responsibly, combined wit
- Page 25 and 26: Our growth drivers of sales growth,
- Page 27 and 28: Principal Risks and UncertaintiesA
- Page 29 and 30: Competition LawOverviewWe take comp
- Page 31: Reconciliation of Adjusted Performa
- Page 35 and 36: Lambert & Butler and Richmond remai
- Page 37 and 38: Within this the travel retail marke
- Page 39 and 40: OutlookThe strength of our portfoli
- Page 41 and 42: Blondes. In the Middle East, we aga
- Page 43 and 44: Corporate ResponsibilityOur Corpora
- Page 45 and 46: Corporate Responsibility and our St
- Page 47 and 48: We have revised our IMS and employe
- Page 49 and 50: Environmental Performance 1Absolute
- Page 51 and 52: across the business. More informati
- Page 53 and 54: Supplier RelationshipsOur main supp
- Page 55 and 56: Non-financial performance indicator
- Page 57 and 58: “High standards of corporategover
- Page 59 and 60: 5. Pierre Jungels, CBE (HON), PHD,
- Page 61 and 62: Management and Corporate StructureB
- Page 63 and 64: Meetings of the Board, Board Commit
- Page 65 and 66: and supplemented by our Non-Executi
- Page 67 and 68: 6 Performance evaluation: How do we
- Page 69 and 70: The Board recognises that we operat
- Page 71 and 72: Assurance process for financial rep
- Page 73 and 74: - receiving reports from, and quest
- Page 75 and 76: Directors’ Report: Other Informat
- Page 77 and 78: - state whether IFRSs as adopted by
- Page 79 and 80: We understand that a purported coll
- Page 81 and 82: This Report covers the following:1
- Page 83 and 84:
2 Directors’ Emoluments for the Y
- Page 85 and 86:
Directors’ Interests in Ordinary
- Page 87 and 88:
Executive Directors’ Service Agre
- Page 89 and 90:
When setting base salary the Remune
- Page 91 and 92:
First ElementFifty per cent of the
- Page 93 and 94:
In respect of the October 2007 - Oc
- Page 95 and 96:
Any annual bonus earned up to 100 p
- Page 97 and 98:
Benefit Trusts have also been provi
- Page 99 and 100:
Independent Auditors’ Reportto th
- Page 101 and 102:
Consolidated Statement ofComprehens
- Page 103 and 104:
Consolidated Statement of Changes i
- Page 105 and 106:
Accounting PoliciesBasis of Prepara
- Page 107 and 108:
Duty and Similar ItemsDuty and simi
- Page 109 and 110:
InventoriesInventories are stated a
- Page 111 and 112:
Restructuring CostsSignificant one-
- Page 113 and 114:
Property, Plant and Equipment and I
- Page 115 and 116:
Tobacco net revenue£ million 2010
- Page 117 and 118:
3 Restructuring Costs£ million 201
- Page 119 and 120:
Factors affecting the tax charge fo
- Page 121 and 122:
9 Intangible Assets2010£ million G
- Page 123 and 124:
10 Property, Plant and Equipment201
- Page 125 and 126:
13 Trade and Other Receivables2010
- Page 127 and 128:
Sensitivity analysisIFRS 7 requires
- Page 129 and 130:
At 30 September 2009Balance sheetam
- Page 131 and 132:
(iii) Currency analysis and effecti
- Page 133 and 134:
(iv) Derivative financial instrumen
- Page 135 and 136:
Matures in financial year ending in
- Page 137 and 138:
The following tables are provided i
- Page 139 and 140:
Matures in financial year ending in
- Page 141 and 142:
(vi) Hedge of net investments in fo
- Page 143 and 144:
18 Retirement Benefit SchemesThe Gr
- Page 145 and 146:
Assumptions regarding future mortal
- Page 147 and 148:
21 Share SchemesThe Group recognise
- Page 149 and 150:
Year from 1 October 2008 to 30 Sept
- Page 151 and 152:
23 CommitmentsCapital commitments£
- Page 153 and 154:
27 Reconciliation of Cash Flow to M
- Page 155 and 156:
Imperial Tobacco Group PLC Balance
- Page 157 and 158:
(iii) Debtors: Amounts Falling Due
- Page 159 and 160:
Principal SubsidiariesThe principal
- Page 161 and 162:
Shareholder InformationRegistered O
- Page 163 and 164:
IndexAAccounting Policies 103Acquis