- Page 1 and 2: The Protein Protocols Handbook SECO
- Page 3 and 4: The Protein Protocols Handbook SECO
- Page 5 and 6: Preface The Protein Protocols Handb
- Page 7 and 8: viii Contents 14 Identification of
- Page 9 and 10: x Contents 47 Conjugation of Fluoro
- Page 11 and 12: xii Contents 80 Peptide Mapping by
- Page 13 and 14: xiv Contents 112 Sialic Acid Analys
- Page 15 and 16: xvi Contents 145 Purification of Ig
- Page 17 and 18: Contributors THOMAS E. ADRIAN • D
- Page 19 and 20: Contributors xxi RUTH R. FRENCH •
- Page 21 and 22: Contributors xxiii STEFANIE A. NELS
- Page 23 and 24: UV Absorption 1 PART I QUANTITATION
- Page 25 and 26: 4 Aitken and Learmonth 2. Materials
- Page 27 and 28: 6 Aitken and Learmonth References 1
- Page 29 and 30: 8 Waterborg 3. Method 1. To 0.1 mL
- Page 31 and 32: BCA for Protein Quantitation 11 3 T
- Page 33 and 34: BCA for Protein Quantitation 13 Tab
- Page 35 and 36: The Bradford Method 15 4 The Bradfo
- Page 37 and 38: The Bradford Method 17 Fig. 1. Vari
- Page 39 and 40: The Bradford Method 19 Table 2 Comp
- Page 41 and 42: The Bradford Method 21 13. Kirazov,
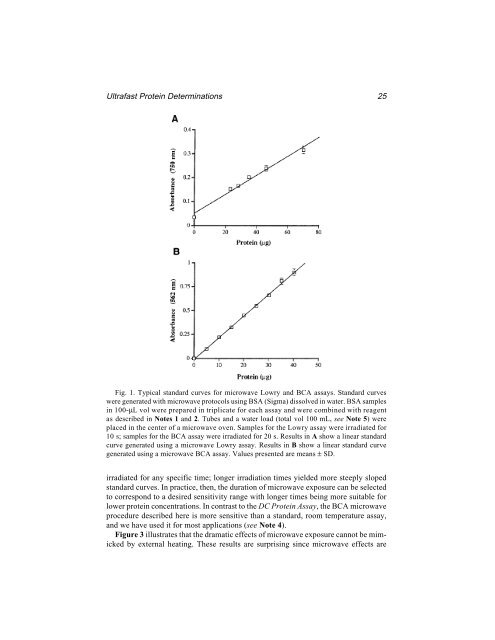
- Page 43: 24 Akins and Tuan passes. The side
- Page 47 and 48: 28 Akins and Tuan protein concentra
- Page 49 and 50: 30 Akins and Tuan energy. Too much
- Page 51 and 52: 32 Boerner et al. Several approache
- Page 53 and 54: 34 Boerner et al. Fig. 2. 3-Nitroty
- Page 55 and 56: 36 Boerner et al. containing Tris,
- Page 57 and 58: 38 Boerner et al. 2.2. Nitric Acid
- Page 59 and 60: 40 Boerner et al. 8. Böhlen, P., S
- Page 61 and 62: 42 Aitken and Learmonth 1.2. Measur
- Page 63 and 64: 44 Aitken and Learmonth References
- Page 65 and 66: 46 Friedrich et al. 2. Materials 2.
- Page 67 and 68: 48 Friedrich et al. Fig. 1. Differe
- Page 69 and 70: 50 Friedrich et al. References 1. S
- Page 71 and 72: 52 Root and Wang Fig. 1. Representa
- Page 73 and 74: 54 Root and Wang 4. Kinetic silver
- Page 75 and 76: Gel Electrophoresis of Proteins 57
- Page 77 and 78: Gel Electrophoresis of Proteins 59
- Page 79 and 80: SDS-PAGE 61 11 SDS Polyacrylamide G
- Page 81 and 82: SDS-PAGE 63 their own rates. A more
- Page 83 and 84: SDS-PAGE 65 7. To ensure that the g
- Page 85 and 86: SDS-PAGE 67 close to the dye, and t
- Page 87 and 88: 70 Walker 2. Buffers: a. 1.875 M Tr
- Page 89 and 90: 72 Walker Fig. 2. Diagrammatic repr
- Page 91 and 92: 74 Judd 2. Materials 2.1. Equipment
- Page 93 and 94: 76 Judd ber with anode buffer. Remo
- Page 95 and 96:
78 Judd 4. Run the gel as described
- Page 97 and 98:
SDecS-PAGE of Nucleic Acid Binding
- Page 99 and 100:
SDecS-PAGE of Nucleic Acid Binding
- Page 101 and 102:
SDecS-PAGE of Nucleic Acid Binding
- Page 103 and 104:
CAT Gel Electrophoresis 87 15 Cetyl
- Page 105 and 106:
CAT Gel Electrophoresis 89 Fig. 1.
- Page 107 and 108:
CAT Gel Electrophoresis 91 3. CAT s
- Page 109 and 110:
CAT Gel Electrophoresis 93 Table 1
- Page 111 and 112:
CAT Gel Electrophoresis 95 the tank
- Page 113 and 114:
CAT Gel Electrophoresis 97 may be a
- Page 115 and 116:
CAT Gel Electrophoresis 99 enzyme p
- Page 117 and 118:
CAT Gel Electrophoresis 101 20. Rey
- Page 119 and 120:
104 Waterborg Fig. 1. Histones of t
- Page 121 and 122:
106 Waterborg 9. Riboflavin-5'-phos
- Page 123 and 124:
108 Waterborg 25. Remove the bottom
- Page 125 and 126:
110 Waterborg 10. The amount of pro
- Page 127 and 128:
AUT Gel for Histones 113 17 Acid-Ur
- Page 129 and 130:
AUT Gel for Histones 115 Details of
- Page 131 and 132:
AUT Gel for Histones 117 Fig. 2. (A
- Page 133 and 134:
AUT Gel for Histones 119 13. Add 0.
- Page 135 and 136:
AUT Gel for Histones 121 5. The sep
- Page 137 and 138:
AUT Gel for Histones 123 15. Waterb
- Page 139 and 140:
126 Walker the cost of preparing IE
- Page 141 and 142:
128 Walker 4. Notes 1. The sucrose
- Page 143 and 144:
Protein Solubility in 2-D Electroph
- Page 145 and 146:
Protein Solubility in 2-D Electroph
- Page 147 and 148:
Protein Solubility in 2-D Electroph
- Page 149 and 150:
Protein Solubility in 2-D Electroph
- Page 151 and 152:
Protein Solubility in 2-D Electroph
- Page 153 and 154:
Fractionated Extraction 141 20 Prep
- Page 155 and 156:
Fractionated Extraction 143 Fig. 1.
- Page 157 and 158:
Fractionated Extraction 145 Table 2
- Page 159 and 160:
Fractionated Extraction 147 13. Com
- Page 161 and 162:
149 SI + II fraction: liver Brain H
- Page 163 and 164:
Fractionated Extraction 151 3. Add
- Page 165 and 166:
Fractionated Extraction 153 Fig. 2.
- Page 167 and 168:
Fractionated Extraction 155 and bra
- Page 169 and 170:
Fractionated Extraction 157 ume are
- Page 171 and 172:
160 Bizios 2. Materials 2.1. Equipm
- Page 173 and 174:
162 Bizios 5. Sample preparation sh
- Page 175 and 176:
164 Gravel Fig. 1. Tube Cell Model
- Page 177 and 178:
166 Gravel 3. Fill the lower chambe
- Page 179 and 180:
168 Gravel lysis solution A (SDS-DT
- Page 181 and 182:
170 Gianazza Fig. 1. Structure of t
- Page 183 and 184:
172 Gianazza Table 1 pK Values of I
- Page 185 and 186:
174 Gianazza Fig. 2. Course of the
- Page 187 and 188:
176 Gianazza Table 3 IPG 4-7 and 6-
- Page 189 and 190:
178 Gianazza the gel. Depending on
- Page 191 and 192:
180 Gianazza 17. Chiari, M., Pagani
- Page 193 and 194:
182 Lopez 3. Slide a grommet onto e
- Page 195 and 196:
DIGE 185 25 Difference Gel Electrop
- Page 197 and 198:
DIGE 187 2.2. IEF Fig 1. The two cy
- Page 199 and 200:
DIGE 189 3. Method 3.1. Sample Solu
- Page 201 and 202:
DIGE 191 Strips, the instructions t
- Page 203 and 204:
DIGE 193 2. Push the strip down unt
- Page 205 and 206:
DIGE 195 4. The presence of Pharmal
- Page 207 and 208:
Comparing 2-D Gels on the Internet
- Page 209 and 210:
Comparing 2-D Gels on the Internet
- Page 211 and 212:
Comparing 2-D Gels on the Internet
- Page 213 and 214:
Comparing 2-D Gels on the Internet
- Page 215 and 216:
Comparing 2-D Gels on the Internet
- Page 217 and 218:
Comparing 2-D Gels on the Internet
- Page 219 and 220:
Comparing 2-D Gels on the Internet
- Page 221 and 222:
Comparing 2-D Gels on the Internet
- Page 223 and 224:
Comparing 2-D Gels on the Internet
- Page 225 and 226:
Immunoblotting of 2-DE Separated Pr
- Page 227 and 228:
Immunoblotting of 2-DE Separated Pr
- Page 229 and 230:
Immunoblotting of 2-DE Separated Pr
- Page 231 and 232:
Immunoblotting of 2-DE Separated Pr
- Page 233 and 234:
Immunoblotting of 2-DE Separated Pr
- Page 235 and 236:
Immunoblotting of 2-DE Separated Pr
- Page 237 and 238:
Immunoblotting of 2-DE Separated Pr
- Page 239 and 240:
Immunoblotting of 2-DE Separated Pr
- Page 241 and 242:
232 Springer Fig. 1. Comparison of
- Page 243 and 244:
234 Springer Table 1 Recipe for Var
- Page 245 and 246:
Quantification of Proteins on Gels
- Page 247 and 248:
Quantification of Proteins on Gels
- Page 249 and 250:
Quantification of Proteins on Gels
- Page 251 and 252:
Rapid Staining with Nile Red 243 30
- Page 253 and 254:
Rapid Staining with Nile Red 245 Fi
- Page 255 and 256:
Rapid Staining with Nile Red 247 11
- Page 257 and 258:
Rapid Staining with Nile Red 249 Re
- Page 259 and 260:
252 Fernandez-Patron to years witho
- Page 261 and 262:
254 Fernandez-Patron Fig. 2. Revers
- Page 263 and 264:
256 Fernandez-Patron spectrometry (
- Page 265 and 266:
258 Fernandez-Patron 11. Fernandez-
- Page 267 and 268:
260 Choi, Hong, and Yoo Table 1 Lin
- Page 269 and 270:
262 Choi, Hong, and Yoo Fig. 2. Mec
- Page 271 and 272:
Silver Staining of Proteins 265 33
- Page 273 and 274:
Silver Staining of Proteins 267 Fig
- Page 275 and 276:
Silver Staining of Proteins 269 3.3
- Page 277 and 278:
Silver Staining of Proteins 271 12.
- Page 279 and 280:
274 Patton plexes for colorimetric
- Page 281 and 282:
276 Patton device (CCD) camera. The
- Page 283 and 284:
278 Patton 3.2. Luminescent Detecti
- Page 285 and 286:
280 Patton 3.5. Luminescent Detecti
- Page 287 and 288:
282 Patton EDTA, pH 9.6 or using SY
- Page 289 and 290:
284 Patton filter. Proteins stained
- Page 291 and 292:
286 Patton 17. Lim, M., Patton, W.,
- Page 293 and 294:
288 Dunn variations in silver stain
- Page 295 and 296:
290 Dunn Fig. 1. A 2-DE separation
- Page 297 and 298:
292 Dunn 11. Stephens, R. E. (1975)
- Page 299 and 300:
Gels Using Eosin Y Stain 295 36 Det
- Page 301 and 302:
Gels Using Eosin Y Stain 297 3. An
- Page 303 and 304:
300 Jenö and Horst and Coomassie B
- Page 305 and 306:
302 Jenö and Horst Fig. 1. Side (A
- Page 307 and 308:
304 Jenö and Horst BT1 membrane, o
- Page 309 and 310:
Autoradiography and Fluorography 30
- Page 311 and 312:
Autoradiography and Fluorography 30
- Page 313 and 314:
Autoradiography and Fluorography 31
- Page 315 and 316:
Autoradiography and Fluorography 31
- Page 317 and 318:
Blotting-Electroblotting 315 PART I
- Page 319 and 320:
318 Page and Thorpe 4. Filter paper
- Page 322 and 323:
Semidry Protein Blotting 321 40 Pro
- Page 324 and 325:
Semidry Protein Blotting 323 2. Mem
- Page 326 and 327:
Discontinuous buffer systems Tris-g
- Page 328 and 329:
327 Table 2 Membranes Used for Elec
- Page 330 and 331:
Semidry Protein Blotting 329 Fig. 2
- Page 332 and 333:
Semidry Protein Blotting 331 Table
- Page 334 and 335:
Semidry Protein Blotting 333 24 h l
- Page 336 and 337:
Protein Blotting 335 41 Protein Blo
- Page 338 and 339:
Western Blotting of Basic Proteins
- Page 340 and 341:
Western Blotting of Basic Proteins
- Page 342 and 343:
Western Blotting of Basic Proteins
- Page 344 and 345:
344 Wisdom 4. Glutaraldehyde. 5. 50
- Page 346 and 347:
346 Wisdom 3. Methods 1. Dissolve 1
- Page 348 and 349:
348 Wisdom 3. Dialyze the modified
- Page 350 and 351:
350 Wisdom 6. Store the labeled ant
- Page 352 and 353:
352 Mao terminus. The ε-amino grou
- Page 354 and 355:
354 Mao conjugate with optimal modi
- Page 356 and 357:
356 Haugland and You Fig. 1. Struct
- Page 358 and 359:
358 Haugland and You Because of its
- Page 360 and 361:
360 Haugland and You 5. Dissolve 10
- Page 362 and 363:
362 Haugland and You ing with one a
- Page 364 and 365:
Preparation of Avidin Conjugates 36
- Page 366 and 367:
Preparation of Avidin Conjugates 36
- Page 368 and 369:
Preparation of Avidin Conjugates 36
- Page 370 and 371:
Preparation of Avidin Conjugates 37
- Page 372 and 373:
Preparation of Avidin Conjugates 37
- Page 374 and 375:
Staining with MDPF 375 50 MDPF Stai
- Page 376 and 377:
Staining with MDPF 377 transillumin
- Page 378 and 379:
Staining with MDPF 379 3. Alba, F.
- Page 380 and 381:
382 Root and Wang suspension become
- Page 382 and 383:
384 Root and Wang Fig. 1. Schematic
- Page 384 and 385:
Blots Using Direct Blue 71 387 52 D
- Page 386 and 387:
Blots Using Direct Blue 71 389 3.2.
- Page 388 and 389:
Blots Using Direct Blue 71 391 Fig.
- Page 390 and 391:
Immunogold 393 53 Protein Staining
- Page 392 and 393:
Immunogold 395 Fig. 2. Schematic re
- Page 394 and 395:
Immunogold 397 6. AuroProbe BLplus
- Page 396 and 397:
Immunogold 399 Fig. 5. Comparison o
- Page 398 and 399:
Immunogold 401 Table 2 Effect of Te
- Page 400 and 401:
Immunogold 403 15. AuroDye forte is
- Page 402 and 403:
Immunoblotting Using Secondary Liga
- Page 404 and 405:
Immunoblotting Using Secondary Liga
- Page 406 and 407:
Immunoblotting Using Secondary Liga
- Page 408 and 409:
Immunoblotting Using Secondary Liga
- Page 410 and 411:
Immunoblotting Using Secondary Liga
- Page 412 and 413:
Avidin-or Streptavidin-Biotin 415 5
- Page 414 and 415:
Avidin-or Streptavidin-Biotin 417 2
- Page 416 and 417:
Avidin-or Streptavidin-Biotin 419 R
- Page 418 and 419:
422 Copse and Fowler substrate to a
- Page 420 and 421:
424 Copse and Fowler 2. Orbital sha
- Page 422 and 423:
426 Copse and Fowler 4. Notes 4.1.
- Page 424 and 425:
428 Copse and Fowler 18. DDAO-phosp
- Page 426 and 427:
430 Dickinson and Fowler the advant
- Page 428 and 429:
432 Dickinson and Fowler 2. Membran
- Page 430 and 431:
434 Dickinson and Fowler Fig. 2. (A
- Page 432 and 433:
436 Dickinson and Fowler biotinylat
- Page 435 and 436:
Reutilization of Western Blots 439
- Page 437 and 438:
Reutilization of Western Blots 441
- Page 439 and 440:
Reutilization of Western Blots 443
- Page 441 and 442:
Reutilization of Western Blots 445
- Page 443 and 444:
Reutilization of Western Blots 447
- Page 445 and 446:
Reutilization of Western Blots 449
- Page 447 and 448:
Reutilization of Western Blots 451
- Page 449 and 450:
Carboxymethylation of Cysteine 453
- Page 451 and 452:
456 Aitken and Learmonth 11. Microd
- Page 453 and 454:
458 Aitken and Learmonth Table 1 El
- Page 455 and 456:
460 Aitken and Learmonth 4. Notes 1
- Page 457 and 458:
462 Ward Fig. 1. Amino acid sequenc
- Page 459 and 460:
Chemical Modifications of Proteins
- Page 461 and 462:
Chemical Modifications of Proteins
- Page 463 and 464:
470 Tawfik 3. Method 3.1. Nitration
- Page 465 and 466:
472 Tawfik preparation by pH-depend
- Page 467 and 468:
474 Tawfik 4. Notes 1. The concentr
- Page 469 and 470:
476 Tawfik 2. A molar excess of p-h
- Page 471 and 472:
478 Tawfik 3. Method 1. Add the gly
- Page 473 and 474:
480 Tawfik 3. Method 1. Dissolve th
- Page 475 and 476:
482 Tawfik 4. Notes 1. At neutral a
- Page 477 and 478:
484 Tawfik 4. Notes 1. Release of t
- Page 479 and 480:
486 Smith 6. Equipment includes a n
- Page 481 and 482:
488 Smith 3. Although the specifici
- Page 483 and 484:
490 Smith those bearing a prolyl re
- Page 485 and 486:
Cleavage at Tryptophanyl-x Bonds 49
- Page 487 and 488:
Alternative conditions for rapid re
- Page 489 and 490:
Cleavage at Tryptophanyl-x Bonds 49
- Page 491 and 492:
Cleavage at Aspartyl-X Bonds 499 73
- Page 493 and 494:
Cleavage at Aspartyl-X Bonds 501 pr
- Page 495 and 496:
Cleavage at Cysteinyl-x Bonds 503 7
- Page 497 and 498:
Cleavage at Cysteinyl-x Bonds 505 F
- Page 499 and 500:
Cleavage at Asparaginyl-Glycyl Bond
- Page 501 and 502:
Cleavage at Asparaginyl-Glycyl Bond
- Page 503 and 504:
Enzymatic Digestion 511 76 Enzymati
- Page 505 and 506:
Enzymatic Digestion 513 then remove
- Page 507 and 508:
Enzymatic Digestion 515 Fig. 1. In-
- Page 509 and 510:
Enzymatic Digestion 517 In the case
- Page 511 and 512:
Enzymatic Digestion 519 Another app
- Page 513 and 514:
Enzymatic Digestion 521 11. Modific
- Page 515 and 516:
524 Table 1 Digestion Buffers Recip
- Page 517 and 518:
526 Fernandez and Mische Fig. 1. Pe
- Page 519 and 520:
528 Fernandez and Mische 3. Excise
- Page 521 and 522:
530 Fernandez and Mische 3. The lar
- Page 523 and 524:
532 Fernandez and Mische membrane a
- Page 525 and 526:
534 Stone and Williams 2. Materials
- Page 527 and 528:
536 Stone and Williams In those few
- Page 529 and 530:
538 Stone and Williams (while maint
- Page 531 and 532:
540 Stone and Williams Biochemistry
- Page 533 and 534:
2-D TLE-TLC Mapping 543 79 Peptide
- Page 535 and 536:
2-D TLE-TLC Mapping 545 12. 0.25% N
- Page 537 and 538:
2-D TLE-TLC Mapping 547 3. Incubate
- Page 539 and 540:
2-D TLE-TLC Mapping 549 Table 1 Cle
- Page 541 and 542:
2-D TLE-TLC Mapping 551 Fig. 1. Exa
- Page 543 and 544:
SDS-PAGE Mapping 553 80 Peptide Map
- Page 545 and 546:
SDS-PAGE Mapping 555 3. Overlay sam
- Page 547 and 548:
SDS-PAGE Mapping 557 Fig. 1. Exampl
- Page 549 and 550:
560 Judd Fig. 1. Example of peptide
- Page 551 and 552:
Protein Hydrolysates 563 82 Product
- Page 553 and 554:
Protein Hydrolysates 565 2. Pronase
- Page 555 and 556:
Amino Acid Analysis with Marfey’s
- Page 557 and 558:
Amino Acid Analysis with Marfey’s
- Page 559 and 560:
Amino Acid Analysis with Marfey’s
- Page 561 and 562:
HPSEC 573 84 Molecular Weight Estim
- Page 563 and 564:
HPSEC 575 Table 1 Protein Standards
- Page 565 and 566:
HPSEC 577 Fig. 2. Plot of K d vs lo
- Page 567 and 568:
HPSEC 579 with care (see suppliers
- Page 569 and 570:
582 Aitken larly good resolution de
- Page 571 and 572:
Disulfide-Linked Peptide Detection
- Page 573 and 574:
Disulfide-Linked Peptide Detection
- Page 575 and 576:
Disulfide Bridges 589 87 Diagonal E
- Page 577 and 578:
Disulfide Bridges 591 3. Spot the s
- Page 579 and 580:
Disulfide Bridges 593 2. The moveme
- Page 581 and 582:
596 Aitken and Learmonth 6. Finally
- Page 583 and 584:
598 Aitken and Learmonth Fig. 1. (A
- Page 585 and 586:
600 Aitken and Learmonth 2.4. Elect
- Page 587 and 588:
602 Aitken and Learmonth 6. Takahas
- Page 589 and 590:
604 Colyer of the protein of intere
- Page 591 and 592:
606 Colyer 8. After 16 h of exposur
- Page 593 and 594:
608 Colyer stoichiometry, since it
- Page 595 and 596:
610 Bonenfant, Mini, and Jenö indi
- Page 597 and 598:
612 Bonenfant, Mini, and Jenö for
- Page 599 and 600:
614 Bonenfant, Mini, and Jenö incl
- Page 601 and 602:
616 Bonenfant, Mini, and Jenö Fig.
- Page 603 and 604:
618 Bonenfant, Mini, and Jenö Fig.
- Page 605 and 606:
620 Bonenfant, Mini, and Jenö up t
- Page 607 and 608:
622 Bonenfant, Mini, and Jenö 5. L
- Page 609 and 610:
624 Weber and McFadden Fig. 1. Sche
- Page 611 and 612:
626 Weber and McFadden 4. Using a p
- Page 613 and 614:
628 Weber and McFadden Fig. 2. Comp
- Page 615 and 616:
630 Weber and McFadden Fig. 4. Coom
- Page 617 and 618:
Protein Palmitoylation 633 93 Analy
- Page 619 and 620:
Protein Palmitoylation 635 Fig. 1.
- Page 621 and 622:
Protein Palmitoylation 637 1. Fix p
- Page 623 and 624:
Protein Palmitoylation 639 7. Mumby
- Page 625 and 626:
Fig. 1. Structure of the natural an
- Page 627 and 628:
644 Corsini 8. Simvastatin in its l
- Page 629 and 630:
646 Corsini Fig. 3. Schematic for t
- Page 631 and 632:
648 Corsini Table 1 Mevalonate, Pre
- Page 633 and 634:
650 Corsini Fig. 5. Metabolic label
- Page 635 and 636:
652 Corsini Fig. 7. Two-dimensional
- Page 637 and 638:
654 Corsini 7. When prenylated prot
- Page 639 and 640:
656 Corsini 24. Danesi, R., McLella
- Page 641 and 642:
658 Andres et al. Fig. 1. Proposed
- Page 643 and 644:
660 Andres et al. Fig. 2. SDS-PAGE
- Page 645 and 646:
662 Andres et al. Fig. 4. Chromatog
- Page 647 and 648:
664 Andres et al. Fig. 6. Specific
- Page 649 and 650:
666 Andres et al. 10. Residual orga
- Page 651 and 652:
668 Andres et al. 2. The metabolica
- Page 653 and 654:
670 Andres et al. 3. Clarke, S. (19
- Page 655 and 656:
Phosphopeptide Mapping 673 96 2-D P
- Page 657 and 658:
Phosphopeptide Mapping 675 3. Add 1
- Page 659 and 660:
Phosphopeptide Mapping 677 Fig. 1.
- Page 661 and 662:
Phosphopeptide Mapping 679 until th
- Page 663 and 664:
Protein Mutations by MS 681 97 Dete
- Page 665 and 666:
Protein Mutations by MS 683 protein
- Page 667 and 668:
Protein Mutations by MS 685 Fig. 2.
- Page 669 and 670:
Protein Mutations by MS 687 Fig. 4.
- Page 671 and 672:
Protein Mutations by MS 689 Fig. 7.
- Page 673 and 674:
Protein Mutations by MS 691 Fig. 10
- Page 675 and 676:
Nanoelectrospray MS/MS for Peptide
- Page 677 and 678:
Nanoelectrospray MS/MS for Peptide
- Page 679 and 680:
Nanoelectrospray MS/MS for Peptide
- Page 681 and 682:
Nanoelectrospray MS/MS for Peptide
- Page 683 and 684:
Nanoelectrospray MS/MS for Peptide
- Page 685 and 686:
Nanoelectrospray MS/MS for Peptide
- Page 687 and 688:
Nanoelectrospray MS/MS for Peptide
- Page 689 and 690:
Nanoelectrospray MS/MS for Peptide
- Page 691 and 692:
Nanoelectrospray MS/MS for Peptide
- Page 693 and 694:
MALDI-MS for Protein Identification
- Page 695 and 696:
MALDI-MS for Protein Identification
- Page 697 and 698:
MALDI-MS for Protein Identification
- Page 699 and 700:
MALDI-MS for Protein Identification
- Page 701 and 702:
MALDI-MS for Protein Identification
- Page 703 and 704:
MALDI-MS for Protein Identification
- Page 705 and 706:
MALDI-MS for Protein Identification
- Page 707 and 708:
MALDI-MS for Protein Identification
- Page 709 and 710:
MALDI-MS for Protein Identification
- Page 711 and 712:
MALDI-MS for Protein Identification
- Page 713 and 714:
MALDI-MS for Protein Identification
- Page 715 and 716:
Protein Ladder Sequencing 733 100 P
- Page 717 and 718:
Protein Ladder Sequencing 735 Prote
- Page 719 and 720:
Protein Ladder Sequencing 737 3. Ex
- Page 721 and 722:
Protein Ladder Sequencing 739 2. Wa
- Page 723 and 724:
742 Hennig sequences (see Subheadin
- Page 725 and 726:
744 Hennig In the age of genomics,
- Page 727 and 728:
746 Hennig last defined (last in th
- Page 729 and 730:
748 Spencer and Davie Fig. 1. Two-d
- Page 731 and 732:
750 Spencer and Davie 4. Notes 1. T
- Page 733 and 734:
Proteins Cross-linked to DNA by For
- Page 735 and 736:
Proteins Cross-linked to DNA by For
- Page 737 and 738:
Proteins Cross-linked to DNA by For
- Page 739 and 740:
Glycoprotein Detection 761 104 Dete
- Page 741 and 742:
Glycoprotein Detection 763 Schiff
- Page 743 and 744:
Glycoprotein Detection 765 3.1.1. G
- Page 745 and 746:
Glycoprotein Detection 767 Table 1
- Page 747 and 748:
Glycoprotein Detection 769 5. Resus
- Page 749 and 750:
Glycoprotein Detection 771 Fig. 1.
- Page 751 and 752:
Detection of Glycosylated Proteins
- Page 753 and 754:
Detection of Glycosylated Proteins
- Page 755 and 756:
Detection of Glycosylated Proteins
- Page 757 and 758:
780 Gravel Fig. 1. Glycoprotein blo
- Page 759 and 760:
782 Gravel Fig. 3. Glycoprotein blo
- Page 761 and 762:
784 Table 1 Glycans N-Glycosidicall
- Page 763 and 764:
786 Table 3 Specificity of Lectins
- Page 765 and 766:
788 Table 3 Specificity of Lectins
- Page 767 and 768:
790 Gravel dimethylformamide. These
- Page 769 and 770:
792 Gravel 3. Montreuil, J., Bouque
- Page 771 and 772:
794 Gravel
- Page 773 and 774:
796 Goodarzi, Fotinopoulou, Turner
- Page 775 and 776:
798 Goodarzi, Fotinopoulou, Turner
- Page 777 and 778:
800 Goodarzi, Fotinopoulou, Turner
- Page 779 and 780:
802 Goodarzi, Fotinopoulou, Turner
- Page 781 and 782:
804 Hounsell, Davies, and Smith 2.
- Page 783 and 784:
806 Hounsell, Davies, and Smith 9.
- Page 785 and 786:
Monosaccharide Analysis by GC 809 1
- Page 787 and 788:
Linkage and Substitution Patterns 8
- Page 789 and 790:
Linkage and Substitution Patterns 8
- Page 791 and 792:
816 Hounsell, Davies, and Smith 10.
- Page 793 and 794:
818 Hounsell, Davies, and Smith 3.
- Page 795 and 796:
820 Hounsell, Davis, and Smith 6. T
- Page 797 and 798:
822 Hounsell, Davies, and Smith 3.
- Page 799 and 800:
824 Mizuochi and Hounsell 3. Method
- Page 801 and 802:
826 Mizuochi and Hounsell Reference
- Page 803 and 804:
828 Hounsell, Davies, and Smith 4.
- Page 805 and 806:
830 Hounsell, Davies, and Smith 6.
- Page 807 and 808:
832 Hounsell, Davies, and Smith 3.
- Page 809 and 810:
834 Weitzhandler et al. alditols (1
- Page 811 and 812:
836 Weitzhandler et al. Fig. 1. HPA
- Page 813 and 814:
838 Weitzhandler et al. 2. Add 0.1
- Page 815 and 816:
Microassay of Protein Glycosylation
- Page 817 and 818:
Microassay of Protein Glycosylation
- Page 819 and 820:
Microassay of Protein Glycosylation
- Page 821 and 822:
Microassay of Protein Glycosylation
- Page 823 and 824:
Microassay of Protein Glycosylation
- Page 825 and 826:
Carbohydrate Electrophoresis 851 12
- Page 827 and 828:
Carbohydrate Electrophoresis 853 2.
- Page 829 and 830:
Carbohydrate Electrophoresis 855 Pl
- Page 831 and 832:
Carbohydrate Electrophoresis 857 12
- Page 833 and 834:
Carbohydrate Electrophoresis 859 Fi
- Page 835 and 836:
Carbohydrate Electrophoresis 861 wa
- Page 837 and 838:
Carbohydrate Electrophoresis 863 24
- Page 839 and 840:
866 Merry blly less expensive than
- Page 841 and 842:
868 Merry 8. Whatman no. 3 chromato
- Page 843 and 844:
870 Merry 4. Dialyze for a minimum
- Page 845 and 846:
872 Merry 9. Leave for 5 min and un
- Page 847 and 848:
874 Merry 2. Column: Reverse-phase
- Page 849 and 850:
Table 1 Incubation Conditions for E
- Page 851 and 852:
878 Merry 3.7. Exoglycosidase Diges
- Page 853 and 854:
880 Merry Fig. 6. Example of exogly
- Page 855 and 856:
882 Merry 17. Rice, K. G., Takahash
- Page 857 and 858:
Glycoprofiling and SPR 885 124 Glyc
- Page 859 and 860:
Glycoprofiling and SPR 887 2. Mater
- Page 861 and 862:
Glycoprofiling and SPR 889 Fig. 3.
- Page 863 and 864:
Glycoprofiling and SPR 891 α2-3 Ne
- Page 865 and 866:
894 Turnbull Fig. 1. Basic principl
- Page 867 and 868:
896 Turnbull 13. Enzyme buffer (0.2
- Page 869 and 870:
898 Turnbull Table 1 Exoenzymes for
- Page 871 and 872:
900 Turnbull Fig. 3. IGS of a hepar
- Page 873 and 874:
902 Turnbull 4. Notes 1. Using larg
- Page 875 and 876:
904 Turnbull 20. Rice, K., Rottink,
- Page 877 and 878:
906 Hooker and James 3. High-perfor
- Page 879 and 880:
908 Hooker and James Fig. 1. Whole
- Page 881 and 882:
910 Hooker and James at individual
- Page 883 and 884:
912 Hooker and James Fig. 4. Sialyl
- Page 885 and 886:
914 Hooker and James 16. Ashton, D.
- Page 887 and 888:
Lectin Affinity Chromatography 917
- Page 889 and 890:
Lectin Affinity Chromatography 919
- Page 891 and 892:
Lectin Affinity Chromatography 921
- Page 893 and 894:
Lectin Affinity Chromatography 923
- Page 895 and 896:
Lectin Affinity Chromatography 925
- Page 897 and 898:
Lectin Affinity Chromatography 927
- Page 899 and 900:
Lectin Affinity Chromatography 929
- Page 901 and 902:
Lectin Affinity Chromatography 931
- Page 903 and 904:
Antibody Production 935 128 Antibod
- Page 905 and 906:
Antibody Production 937 1.1. Donor
- Page 907 and 908:
Antibody Production 939 2. Material
- Page 909 and 910:
Production of Anitbodies Using Prot
- Page 911 and 912:
Production of Anitbodies Using Prot
- Page 913 and 914:
Production of Polyclonal Antibodies
- Page 915 and 916:
Production of Polyclonal Antibodies
- Page 917 and 918:
Production of Polyclonal Antibodies
- Page 919 and 920:
Production of Polyclonal Antibodies
- Page 921 and 922:
Peptide Conjugation and Immunizatio
- Page 923 and 924:
Peptide Conjugation and Immunizatio
- Page 925 and 926:
Peptide Conjugation and Immunizatio
- Page 927 and 928:
Peptide Conjugation and Immunizatio
- Page 929 and 930:
Peptide Conjugation and Immunizatio
- Page 931 and 932:
964 Bailey is oxidized by chloramin
- Page 933 and 934:
The Lactoperoxidase Method 967 133
- Page 935 and 936:
The Bolton and Hunter Method 969 13
- Page 937 and 938:
Radioiodination Using IODO-GEN 971
- Page 939 and 940:
Radioiodination Using IODO-GEN 973
- Page 941 and 942:
Radioiodination Using IODO-GEN 975
- Page 943 and 944:
Radioiodination Using IODO-GEN 977
- Page 945 and 946:
980 Bailey 3. Specific antiseum to
- Page 947 and 948:
982 Bailey Amount of radioactivity
- Page 949 and 950:
984 Page and Thorpe 2. Centrifuge s
- Page 951 and 952:
DEAE-Sepharose Chromatography 987 1
- Page 953 and 954:
IgG Purification with Ion-Exchange
- Page 955 and 956:
PEG Precipitation 991 141 Purificat
- Page 957 and 958:
994 Page and Thorpe 2. Materials 1.
- Page 959 and 960:
996 Dolman and Thorpe Fig. 1. Typic
- Page 961 and 962:
Antigen-Ligand Columns 999 144 Puri
- Page 963 and 964:
Antigen-Ligand Columns 1001 4. When
- Page 965 and 966:
1004 Page and Thorpe 7. Filter and
- Page 967 and 968:
1006 Page and Thorpe Fig. 1. SDS-PA
- Page 969 and 970:
Purification of IgY from Chicken Eg
- Page 971 and 972:
Purification of IgY from Chicken Eg
- Page 973 and 974:
1014 Fassina et al. limit the use o
- Page 975 and 976:
1016 Fassina et al. 2. Materials Ta
- Page 977 and 978:
1018 Fassina et al. 10. Filter the
- Page 979 and 980:
1020 Fassina et al. 1. Dilute sampl
- Page 981 and 982:
1022 Fassina et al. analysis indica
- Page 983 and 984:
1024 Fassina et al. 6. Khayam-Bashi
- Page 985 and 986:
1026 Hammerl et al. down, with the
- Page 987 and 988:
1028 Hammerl et al. 1. Clean glass
- Page 989 and 990:
1030 Hammerl et al. Fig. 1. Experim
- Page 991 and 992:
1032 Hammerl et al. can “corrode
- Page 993 and 994:
Single-Chain Antibodies 1035 150 Ba
- Page 995 and 996:
Single-Chain Antibodies 1037 ing th
- Page 997 and 998:
Single-Chain Antibodies 1039 6. Mag
- Page 999 and 1000:
Single-Chain Antibodies 1041 XL1-Bl
- Page 1001 and 1002:
Single-Chain Antibodies 1043 fore,
- Page 1003 and 1004:
Single-Chain Antibodies 1045 16. Ho
- Page 1005 and 1006:
Enzymatic Digestion of MAbs 1047 15
- Page 1007 and 1008:
Enzymatic Digestion of MAbs 1049 2.
- Page 1009 and 1010:
Enzymatic Digestion of MAbs 1051 2.
- Page 1011 and 1012:
Making Bispecific Antibodies 1053 1
- Page 1013 and 1014:
Making Bispecific Antibodies 1055 2
- Page 1015 and 1016:
Making Bispecific Antibodies 1057 F
- Page 1017 and 1018:
Phage Display 1059 153 Phage Displa
- Page 1019 and 1020:
Phage Display 1061 5000, 1 mL of 2-
- Page 1021 and 1022:
Phage Display 1063 11. Agarose top:
- Page 1023 and 1024:
Phage Display 1065 3.1.3.2. AFFINIT
- Page 1025 and 1026:
Phage Display 1067 8. Shake vigorou
- Page 1027 and 1028:
Phage Display 1069 4. Notes 1. Fila
- Page 1029 and 1030:
Phage Display 1071 9. Sengupta J.,
- Page 1031 and 1032:
Selection by Panning 1073 154 Scree
- Page 1033 and 1034:
Selection by Panning 1075 Fig. 1. F
- Page 1035 and 1036:
Selection by Panning 1077 12. Centr
- Page 1037 and 1038:
Selection by Panning 1079 4. Notes
- Page 1039 and 1040:
Selection by Panning 1081 33. The
- Page 1041 and 1042:
Antigen Measurement Using ELISA 108
- Page 1043 and 1044:
Antigen Measurement Using ELISA 108
- Page 1045 and 1046:
Antigen Measurement Using ELISA 108
- Page 1047 and 1048:
Enhanced Chemiluminescence 1089 156
- Page 1049 and 1050:
Enhanced Chemiluminescence 1091 Tab
- Page 1051 and 1052:
Enhanced Chemiluminescence 1093 is
- Page 1053 and 1054:
Enhanced Chemiluminescence 1095 lig
- Page 1055 and 1056:
Immunoprecipitation 1097 157 Immuno
- Page 1057 and 1058:
Immunoprecipitation 1099 Table 2 Pr
- Page 1059 and 1060:
Immunoprecipitation 1101 oligosacch
- Page 1061 and 1062:
Immunoprecipitation 1103 6. Very ge
- Page 1063 and 1064:
Immunoprecipitation 1105 2. Dry the
- Page 1065 and 1066:
Short Chapter Title 1107 PART VIII
- Page 1067 and 1068:
1110 Page and Thorpe final quantity
- Page 1069 and 1070:
1112 Page and Thorpe 2. Materials 1
- Page 1071 and 1072:
Making Bispecific Antibodies 1115 1
- Page 1073 and 1074:
161 From: The Protein Protocols Han
- Page 1075 and 1076:
162 From: The Protein Protocols Han
- Page 1077 and 1078:
Affinity Purification of Monoclonal
- Page 1079 and 1080:
Affinity Purification of Monoclonal
- Page 1081 and 1082:
Affinity Purification of Monoclonal
- Page 1083 and 1084:
Affinity Purification of Monoclonal
- Page 1085 and 1086:
An Efficient Method for MAb Product
- Page 1087 and 1088:
An Efficient Method for MAb Product
- Page 1089 and 1090:
An Efficient Method for MAb Product
- Page 1091 and 1092:
An Efficient Method for MAb Product
- Page 1093 and 1094:
An Efficient Method for MAb Product
- Page 1095 and 1096:
Index 1139 Index A Absorbance (UV),
- Page 1097 and 1098:
Index 1141 Electrophoresis of antib
- Page 1099 and 1100:
Index 1143 of glycoproteins, 905-91
- Page 1101 and 1102:
Index 1145 India ink, 338 lectin st
- Page 1103:
The Protein Protocols Handbook Seco