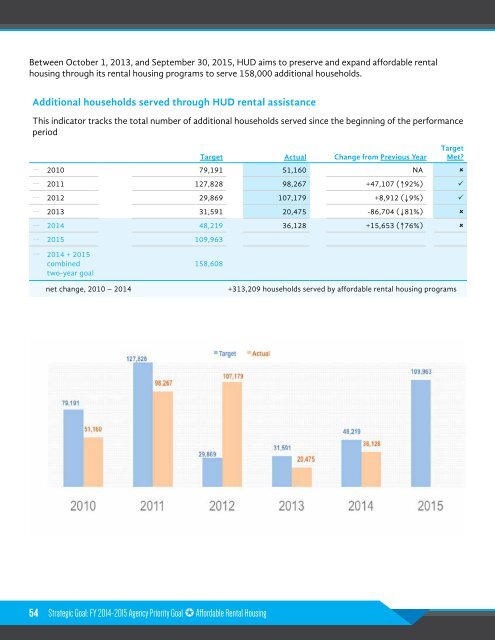
Between October 1, 2013, and September 30, 2015, HUD aims to preserve and expand affordable rental housing through its rental housing programs to serve 158,000 additional households. Additional households served through HUD rental assistance This indicator tracks the total number of additional households served since the beginning of the performance period Target Target Actual Change from Previous Year Met? 2010 79,191 51,160 NA 2011 127,828 98,267 +47,107 (↑92%) 2012 29,869 107,179 +8,912 (↓9%) 2013 31,591 20,475 -86,704 (↓81%) 2014 48,219 36,128 +15,653 (↑76%) 2015 109,963 2014 + 2015 combined two-year goal 158,608 net change, 2010 – 2014 +313,209 households served by affordable rental housing programs 54 Strategic Goal: FY 2014-2015 Agency Priority Goal Affordable Rental Housing
Households in Occupied Rental Units Receiving Assistance by Program FY2012 Cumulative Baseline FY2013 Incremental Actual FY 2013 Cumulative Actual FY 2014 Incremental Target FY 2014 Incremental Actual FY 2014 Cumulative Actual FY 2015 Incremental Target FY 2015 Cumulative Target FY 2016 Incremental Target FY 2016 Cumulative Target 34 Multifamily Project Based Rental Assistance (Section 8) Rental Assistance Demonstration (RAD) units move to PBRA 1,174,914 5,328 1,164,765 35 -4,000 (958) 1,163,807 (7,042) 1,156,765 (1,000) 1,155,765 - 30 30 7,125 2,502 2,532 13,128 15,660 36 27,840 43,500 Other Multifamily Subsidies 37 171,216 (4,870) 166,346 (12,000) (3,414) 162,932 (20,586) 142,346 (4,000) 138,346 Project Rental Assistance Contract (Sect. 202 & 811) 142,977 2,647 145,624 2,568 3,068 148,692 2,808 151,500 400 151,900 Insured Tax Exempt or Low-Income 123,587 2,578 126,165 35,635 38,914 165,079 35,908 200,987 35,000 235,987 Housing Tax Credit 38 Rental Housing Assistance Programs (RAP) See PBRA See PBRA 9,704 (247) (132) 9,572 (1,538) 8,034 (130) 7,904 Rent Supplement See PBRA See PBRA 5,773 1,698 (2,152) 3,621 (1,086) 2,535 (891) 1,644 Mortgage Insurance for Residential Care 2,380 1,484 3,864 750 1,096 4,960 404 5,364 1,110 6,474 Facilities (Sect. 232) 39 TOTAL Housing Programs 1,615,074 7,197 1,622,271 28,133 38,924 1,661,195 21,996 1,683,191 58,329 1,741,520 Tenant Based Rental Assistance (HCV) Rental Assistance Demonstration (RAD) units move to TBRA 2,207,724 (14,179) 2,179,437 3,463 (20,831) 2,158,606 73,194 2,231,800 9,000 2,240,800 - 4,565 4,565 12,028 5,829 10,394 15,663 26,057 33,017 59,073 Public Housing 1,091,758 (1,287) 1,090,471 (18,473) (7,480) 1,082,991 (33,065) 1,049,926 (92,281) 40 957,646 PIH Mod Rehab 22,874 (436) 22,438 (1,068) (1,315) 21,123 (705) 20,418 (705) 19,713 Mainstream Vouchers See HCV 14,108 (1,131) (428) 13,680 390 14,070 - 14,070 Native American Housing (ONAP) TOTAL Public and Indian Housing 11,469 416 11,885 594 544 12,429 594 13,023 594 13,617 3,333,825 (10,921) 3,322,904 (4,587) (23,681) 3,299,223 56,071 3,3,55,294 (50,376) 3,304,918 HOME Rental 257,582 17,674 275,256 20,000 (5,422) 269,834 15,166 275,000 41 (6,000) 269,000 Strategic Goal: 2014-2015 Agency Priority Goal Affordable Rental Housing 55