- Page 1: Nutrition Interventions for Childre
- Page 4 and 5: Nutrition Interventions for Childre
- Page 6 and 7: Kay Kopp, OTR/L Occupational Therap
- Page 8 and 9: Appendices Appendix A Sample Screen
- Page 10 and 11: Nutrition Interventions for Childre
- Page 12 and 13: ii Nutrition Interventions for Chil
- Page 14 and 15: Population “Children with special
- Page 16 and 17: vi Nutrition Interventions for Chil
- Page 18 and 19: Chapter 1 - Nutrition Screening and
- Page 20 and 21: Chapter 1 - Nutrition Screening and
- Page 22 and 23: Chapter 1 - Nutrition Screening and
- Page 24 and 25: Chapter 1 - Nutrition Screening and
- Page 26 and 27: Chapter 1 - Nutrition Screening and
- Page 28 and 29: Chapter 1 - Nutrition Screening and
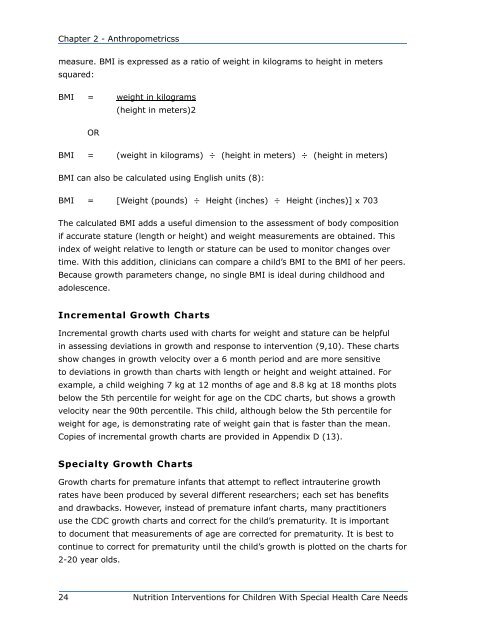
- Page 30 and 31: Chapter 2 - Anthropometricss needs,
- Page 32 and 33: Chapter 2 - Anthropometricss Statur
- Page 34 and 35: Chapter 2 - Anthropometricss Techni
- Page 36 and 37: Chapter 2 - Anthropometricss paraly
- Page 38 and 39: Chapter 2 - Anthropometricss time a
- Page 42 and 43: Chapter 2 - Anthropometricss Mild m
- Page 44 and 45: Chapter 2 - Anthropometricss 9. Re-
- Page 46 and 47: Chapter 2 - Anthropometricss 5. Per
- Page 48 and 49: Chapter 2 - Anthropometrics Table 2
- Page 50 and 51: Chapter 2 - Anthropometricss Refere
- Page 52 and 53: Chapter 2 - Anthropometricss 26. Kr
- Page 54 and 55: Chapter 3 - Physical Activity for C
- Page 56 and 57: Chapter 3 - Physical Activity for C
- Page 58 and 59: Chapter 3 - Physical Activity for C
- Page 60 and 61: Chapter 3 - Physical Activity for C
- Page 62 and 63: Chapter 3 - Physical Activity for C
- Page 64 and 65: Chapter 3 - Physical Activity for C
- Page 66 and 67: Chapter 3 - Physical Activity for C
- Page 68 and 69: Chapter 4 - Breastfeeding recommend
- Page 70 and 71: Chapter 4 - Breastfeeding Table 4-1
- Page 72 and 73: Chapter 4 - Breastfeeding Assessmen
- Page 74 and 75: Chapter 4 - Breastfeeding 58 Nutrit
- Page 76 and 77: Chapter 5 - Medication-Nutrient Int
- Page 78 and 79: Chapter 5 - Medication-Nutrient Int
- Page 80 and 81: Chapter 5 - Medication-Nutrient Int
- Page 82 and 83: Chapter 5 - Medication-Nutrient Int
- Page 84 and 85: Chapter 5 - Medication-Nutrient Int
- Page 86 and 87: Chapter 5 - Medication-Nutrient Int
- Page 88 and 89: Chapter 6 - Nutrition Interventions
- Page 90 and 91:
Chapter 6 - Nutrition Interventions
- Page 92 and 93:
Chapter 6 - Nutrition Interventions
- Page 94 and 95:
Chapter 6 - Nutrition Interventions
- Page 96 and 97:
Chapter 6 - Nutrition Interventions
- Page 98 and 99:
Chapter 7 - Nutrition Interventions
- Page 100 and 101:
Chapter 7 - Nutrition Interventions
- Page 102 and 103:
Chapter 7 - Nutrition Interventions
- Page 104 and 105:
Chapter 7 - Nutrition Interventions
- Page 106 and 107:
Chapter 7 - Nutrition Interventions
- Page 108 and 109:
Chapter 7 - Nutrition Interventions
- Page 110 and 111:
Chapter 8 - Oral-Motor Feeding Prob
- Page 112 and 113:
Chapter 8 - Oral-Motor Feeding Prob
- Page 114 and 115:
Chapter 8 - Oral-Motor Feeding Prob
- Page 116 and 117:
Chapter 8 - Oral-Motor Feeding Prob
- Page 118 and 119:
Chapter 9 - Behavior Issues Related
- Page 120 and 121:
Chapter 9 - Behavior Issues Related
- Page 122 and 123:
Chapter 9 - Behavior Issues Related
- Page 124 and 125:
Chapter 9 - Behavior Issues Related
- Page 126 and 127:
Chapter 9 - Behavior Issues Related
- Page 128 and 129:
Chapter 9 - Behavior Issues Related
- Page 130 and 131:
Chapter 9 - Behavior Issues Related
- Page 132 and 133:
Chapter 9 - Behavior Issues Related
- Page 134 and 135:
Chapter 9 - Behavior Issues Related
- Page 136 and 137:
Chapter 9 - Behavior Issues Related
- Page 138 and 139:
Chapter 10 - Enteral Feeding Other
- Page 140 and 141:
Chapter 10 - Enteral Feeding Table
- Page 142 and 143:
Chapter 10 - Enteral Feeding Table
- Page 144 and 145:
Chapter 10 - Enteral Feeding Refere
- Page 146 and 147:
Chapter 11 - Community Monitoring o
- Page 148 and 149:
Chapter 11 - Community Monitoring o
- Page 150 and 151:
Chapter 11 - Community Monitoring o
- Page 152 and 153:
Chapter 11 - Community Monitoring o
- Page 154 and 155:
Chapter 12 - Accommodating Special
- Page 156 and 157:
Chapter 12 - Accommodating Special
- Page 158 and 159:
Chapter 12 - Accommodating Special
- Page 160 and 161:
Chapter 13 - Nutrition Intervention
- Page 162 and 163:
Chapter 13 - Nutrition Intervention
- Page 164 and 165:
Chapter 13 - Nutrition Intervention
- Page 166 and 167:
Chapter 14 - Nutrition Intervention
- Page 168 and 169:
Chapter 14 - Nutrition Intervention
- Page 170 and 171:
Chapter 14 - Nutrition Intervention
- Page 172 and 173:
Chapter 14 - Nutrition Intervention
- Page 174 and 175:
Chapter 14 - Nutrition Intervention
- Page 176 and 177:
Chapter 14 - Nutrition Intervention
- Page 178 and 179:
Chapter 14 - Nutrition Intervention
- Page 180 and 181:
Chapter 14 - Nutrition Intervention
- Page 182 and 183:
Chapter 15 - Nutrition Intervention
- Page 184 and 185:
Chapter 15 - Nutrition Intervention
- Page 186 and 187:
Chapter 15 - Nutrition Intervention
- Page 188 and 189:
Chapter 15 - Nutrition Intervention
- Page 190 and 191:
Chapter 15 - Nutrition Intervention
- Page 192 and 193:
Chapter 15 - Nutrition Intervention
- Page 194 and 195:
Chapter 16 - Nutrition Intervention
- Page 196 and 197:
Chapter 16 - Nutrition Intervention
- Page 198 and 199:
Chapter 16 - Nutrition Intervention
- Page 200 and 201:
Chapter 16 - Nutrition Intervention
- Page 202 and 203:
Chapter 16 - Nutrition Intervention
- Page 204 and 205:
Chapter 16 - Nutrition Intervention
- Page 206 and 207:
Chapter 16 - Nutrition Intervention
- Page 208 and 209:
Chapter 17 - Nutrition Intervention
- Page 210 and 211:
Chapter 17 - Nutrition Intervention
- Page 212 and 213:
Chapter 17 - Nutrition Intervention
- Page 214 and 215:
Chapter 17 - Nutrition Intervention
- Page 216 and 217:
Chapter 17 - Nutrition Intervention
- Page 218 and 219:
Chapter 17 - Nutrition Intervention
- Page 220 and 221:
Chapter 18 - Nutrition Intervention
- Page 222 and 223:
Chapter 18 - Nutrition Intervention
- Page 224 and 225:
Chapter 18 - Nutrition Intervention
- Page 226 and 227:
Chapter 18 - Nutrition Intervention
- Page 228 and 229:
Chapter 18 - Nutrition Intervention
- Page 230 and 231:
Chapter 18 - Nutrition Intervention
- Page 232 and 233:
Chapter 19 - Nutrition Intervention
- Page 234 and 235:
Chapter 19 - Nutrition Intervention
- Page 236 and 237:
Chapter 19 - Nutrition Intervention
- Page 238 and 239:
Chapter 19 - Nutrition Intervention
- Page 240 and 241:
Chapter 19 - Nutrition Intervention
- Page 242 and 243:
Chapter 19 - Nutrition Intervention
- Page 244 and 245:
Chapter 20 - Nutrition Intervention
- Page 246 and 247:
Chapter 20 - Nutrition Intervention
- Page 248 and 249:
Chapter 20 - Nutrition Intervention
- Page 250 and 251:
Chapter 20 - Nutrition Intervention
- Page 252 and 253:
Chapter 20 - Nutrition Intervention
- Page 254 and 255:
Chapter 21 - Nutrition Intervention
- Page 256 and 257:
Chapter 21 - Nutrition Intervention
- Page 258 and 259:
Chapter 21 - Nutrition Intervention
- Page 260 and 261:
Chapter 21 - Nutrition Intervention
- Page 262 and 263:
Chapter 21 - Nutrition Intervention
- Page 264 and 265:
Chapter 22 - Ketogenic Diet for Sei
- Page 266 and 267:
Chapter 22 - Ketogenic Diet for Sei
- Page 268 and 269:
Chapter 22 - Ketogenic Diet for Sei
- Page 270 and 271:
Chapter 22 - Ketogenic Diet for Sei
- Page 272 and 273:
Chapter 22 - Ketogenic Diet for Sei
- Page 274 and 275:
Chapter 22 - Ketogenic Diet for Sei
- Page 276 and 277:
Chapter 22 - Ketogenic Diet for Sei
- Page 278 and 279:
Chapter 22 - Ketogenic Diet for Sei
- Page 280 and 281:
Chapter 23 - Nutrition Intervention
- Page 282 and 283:
Chapter 23 - Nutrition Intervention
- Page 284 and 285:
Chapter 23 - Nutrition Intervention
- Page 286 and 287:
Chapter 23 - Nutrition Intervention
- Page 288 and 289:
Chapter 23 - Nutrition Intervention
- Page 290 and 291:
Chapter 23 - Nutrition Intervention
- Page 292 and 293:
Appendix A Please list any other nu
- Page 294 and 295:
Appendix A Baby formula What kind o
- Page 296 and 297:
Appendix B Manufacturer Description
- Page 298 and 299:
Appendix C 282 Nutrition Interventi
- Page 300 and 301:
Appendix D 284 Nutrition Interventi
- Page 302 and 303:
Appendix D 286 Nutrition Interventi
- Page 304 and 305:
Appendix D 288 Nutrition Interventi
- Page 306 and 307:
Appendix D 290 Nutrition Interventi
- Page 308 and 309:
Appendix E 292 Nutrition Interventi
- Page 310 and 311:
Appendix E 294 Nutrition Interventi
- Page 312 and 313:
Appendix E 296 Nutrition Interventi
- Page 314 and 315:
Appendix E Table 3: Parent-Specific
- Page 316 and 317:
Appendix F Percentiles of Upper Arm
- Page 318 and 319:
Appendix F 302 Nutrition Interventi
- Page 320 and 321:
Appendix G 304 Nutrition Interventi
- Page 322 and 323:
Appendix G 306 Nutrition Interventi
- Page 324 and 325:
Appendix G 308 Nutrition Interventi
- Page 326 and 327:
Appendix G 310 Nutrition Interventi
- Page 328 and 329:
Appendix H 312 Nutrition Interventi
- Page 330 and 331:
Appendix H 314 Nutrition Interventi
- Page 332 and 333:
Appendix H 316 Nutrition Interventi
- Page 334 and 335:
Appendix H 318 Nutrition Interventi
- Page 336 and 337:
Appendix I 320 Nutrition Interventi
- Page 338 and 339:
Appendix I 322 Nutrition Interventi
- Page 340 and 341:
Appendix I 324 Nutrition Interventi
- Page 342 and 343:
Appendix I 326 Nutrition Interventi
- Page 344 and 345:
Appendix J 328 Nutrition Interventi
- Page 346 and 347:
Appendix J 330 Nutrition Interventi
- Page 348 and 349:
Appendix J 332 Nutrition Interventi
- Page 350 and 351:
Appendix J 334 Nutrition Interventi
- Page 352 and 353:
Appendix K 336 Nutrition Interventi
- Page 354 and 355:
Appendix K 338 Nutrition Interventi
- Page 356 and 357:
Appendix L 340 Nutrition Interventi
- Page 358 and 359:
Appendix M 342 Nutrition Interventi
- Page 360 and 361:
Appendix M 344 Nutrition Interventi
- Page 362 and 363:
Appendix N Gastrostomy Tube Feeding
- Page 364 and 365:
Appendix N activities. When feeding
- Page 366 and 367:
Appendix N Feeding Sets/Extensions
- Page 368 and 369:
Appendix N Fluid and Electrolytes W
- Page 370 and 371:
Appendix N osmolality of full-stren
- Page 372 and 373:
Appendix N Modular Products Modular
- Page 374 and 375:
Appendix N his family, and the home
- Page 376 and 377:
Appendix N • The feeding tube may
- Page 378 and 379:
Appendix N equipment. The Special S
- Page 380 and 381:
Appendix N Table N-2: Common Compli
- Page 382 and 383:
Appendix N Complication Possible Ca
- Page 384 and 385:
Appendix N 368 Nutrition Interventi
- Page 386 and 387:
Appendix O Some conditions increase
- Page 388 and 389:
Appendix O Table O-3: Recommended P
- Page 390 and 391:
Appendix O 374 Nutrition Interventi
- Page 392 and 393:
Appendix P Diet Prescription for Me
- Page 394 and 395:
Appendix Q Goals Considerations for
- Page 396 and 397:
Appendix R Condition Description Nu
- Page 398 and 399:
Appendix R Condition Description Nu
- Page 400 and 401:
Appendix R References 1. Ekvall SW
- Page 402 and 403:
Appendix S Table S-1: Infant Formul
- Page 404 and 405:
Appendix S Comments Osmolality (mOs
- Page 406 and 407:
Appendix S Table S-2: Pediatric For
- Page 408 and 409:
Appendix S Table S-3: Modular Produ
- Page 410 and 411:
Appendix S Comments Energy (kcal) P
- Page 412 and 413:
Appendix S Contact Information Abbo
- Page 414 and 415:
Appendix T Powdered Formulas Accura
- Page 416 and 417:
Appendix T Table T-1: Liquid Concen
- Page 418 and 419:
Appendix T 402 Nutrition Interventi
- Page 420 and 421:
Appendix U Nutrition Strategies for
- Page 422 and 423:
Appendix U ADA Pocket Guide to Nutr
- Page 424 and 425:
Glossary Autism Spectrum Disorders
- Page 426 and 427:
Glossary Early intervention service
- Page 428 and 429:
Glossary Length (recumbent length)
- Page 430 and 431:
Glossary Stadiometer moveable headb
- Page 432 and 433:
Index specialist 98 target 108 Bink
- Page 434 and 435:
Index elemental formula 348 elimina
- Page 436 and 437:
Index I ICF. See International Clas
- Page 438 and 439:
Index risk indicators 4 screening 1
- Page 440 and 441:
Index suppositories 72, 77 Surmonti


