

The Himalaya by the Numbers: A Statistical Analysis - Himalayan ...
The Himalaya by the Numbers: A Statistical Analysis - Himalayan ...
The Himalaya by the Numbers: A Statistical Analysis - Himalayan ...

Create successful ePaper yourself
Turn your PDF publications into a flip-book with our unique Google optimized e-Paper software.
70<br />
60<br />
50<br />
40<br />
30<br />
20<br />
10<br />
0<br />
40<br />
35<br />
30<br />
25<br />
20<br />
15<br />
10<br />
5<br />
0<br />
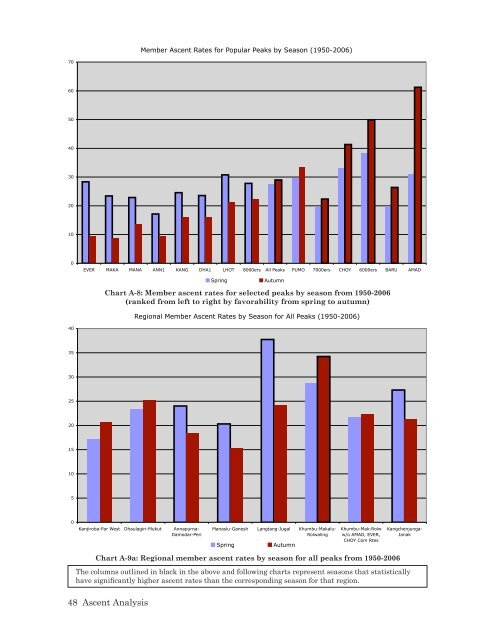
Chart A-8: Member ascent rates for selected peaks <strong>by</strong> season from 1950-2006<br />
(ranked from left to right <strong>by</strong> favorability from spring to autumn)<br />
<strong>The</strong> columns outlined in black in <strong>the</strong> above and following charts represent seasons that statistically<br />
have significantly higher ascent rates than <strong>the</strong> corresponding season for that region.<br />
48 Ascent <strong>Analysis</strong><br />
Member Ascent Rates for Popular Peaks <strong>by</strong> Season (1950-2006)<br />
EVER MAKA MANA ANN1 KANG DHA1 LHOT 8000ers All Peaks PUMO 7000ers CHOY 6000ers BARU AMAD<br />
Spring Autumn<br />
Regional Member Ascent Rates <strong>by</strong> Season for All Peaks (1950-2006)<br />
Kanjiroba-Far West Dhaulagiri-Mukut Annapurna-<br />
Damodar-Peri<br />
Manaslu-Ganesh Langtang-Jugal Khumbu-Makalu-<br />
Rolwaling<br />
Spring Autumn<br />
Khumbu-Mak-Rolw<br />
w/o AMAD, EVER,<br />
CHOY Com Rtes<br />
Chart A-9a: Regional member ascent rates <strong>by</strong> season for all peaks from 1950-2006<br />
Kangchenjunga-<br />
Janak