

The Himalaya by the Numbers: A Statistical Analysis - Himalayan ...
The Himalaya by the Numbers: A Statistical Analysis - Himalayan ...
The Himalaya by the Numbers: A Statistical Analysis - Himalayan ...

You also want an ePaper? Increase the reach of your titles
YUMPU automatically turns print PDFs into web optimized ePapers that Google loves.
Whe<strong>the</strong>r significant or not, <strong>the</strong> death rates are <strong>the</strong> highest in <strong>the</strong> winter season<br />
for both members and hired as would be expected given <strong>the</strong> more difficult climbing<br />
conditions; but considering that only more skilled climbers are likely to attempt winter<br />
expeditions, <strong>the</strong> winter season is probably even more dangerous than what is shown in<br />
<strong>the</strong> chart.<br />
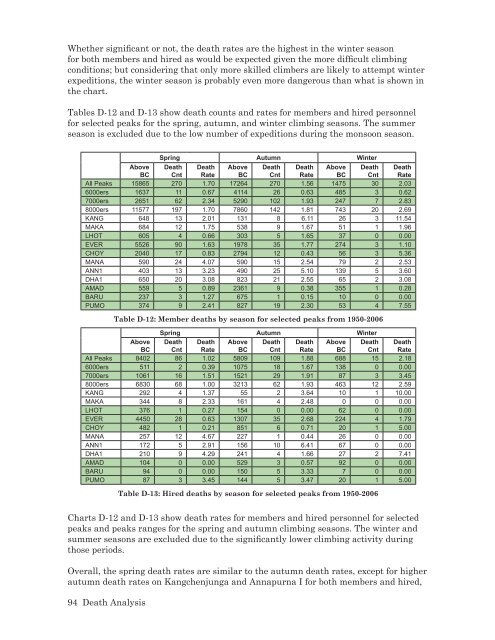
Tables D-12 and D-13 show death counts and rates for members and hired personnel<br />
for selected peaks for <strong>the</strong> spring, autumn, and winter climbing seasons. <strong>The</strong> summer<br />
season is excluded due to <strong>the</strong> low number of expeditions during <strong>the</strong> monsoon season.<br />
Spring Autumn Winter<br />
Above Death Death Above Death Death Above Death Death<br />
BC Cnt Rate BC Cnt Rate BC Cnt Rate<br />
All Peaks 15865 270 1.70 17264 270 1.56 1475 30 2.03<br />
6000ers 1637 11 0.67 4114 26 0.63 485 3 0.62<br />
7000ers 2651 62 2.34 5290 102 1.93 247 7 2.83<br />
8000ers 11577 197 1.70 7860 142 1.81 743 20 2.69<br />
KANG 648 13 2.01 131 8 6.11 26 3 11.54<br />
MAKA 684 12 1.75 538 9 1.67 51 1 1.96<br />
LHOT 605 4 0.66 303 5 1.65 37 0 0.00<br />
EVER 5526 90 1.63 1978 35 1.77 274 3 1.10<br />
CHOY 2040 17 0.83 2794 12 0.43 56 3 5.36<br />
MANA 590 24 4.07 590 15 2.54 79 2 2.53<br />
ANN1 403 13 3.23 490 25 5.10 139 5 3.60<br />
DHA1 650 20 3.08 823 21 2.55 65 2 3.08<br />
AMAD 559 5 0.89 2361 9 0.38 355 1 0.28<br />
BARU 237 3 1.27 675 1 0.15 10 0 0.00<br />
PUMO 374 9 2.41 827 19 2.30 53 4 7.55<br />
Charts D-12 and D-13 show death rates for members and hired personnel for selected<br />
peaks and peaks ranges for <strong>the</strong> spring and autumn climbing seasons. <strong>The</strong> winter and<br />
summer seasons are excluded due to <strong>the</strong> significantly lower climbing activity during<br />
those periods.<br />
Overall, <strong>the</strong> spring death rates are similar to <strong>the</strong> autumn death rates, except for higher<br />
autumn death rates on Kangchenjunga and Annapurna I for both members and hired,<br />
94 Death <strong>Analysis</strong><br />
Table D-12: Member deaths <strong>by</strong> season for selected peaks from 1950-2006<br />
Spring Autumn Winter<br />
Above Death Death Above Death Death Above Death Death<br />
BC Cnt Rate BC Cnt Rate BC Cnt Rate<br />
All Peaks 8402 86 1.02 5809 109 1.88 688 15 2.18<br />
6000ers 511 2 0.39 1075 18 1.67 138 0 0.00<br />
7000ers 1061 16 1.51 1521 29 1.91 87 3 3.45<br />
8000ers 6830 68 1.00 3213 62 1.93 463 12 2.59<br />
KANG 292 4 1.37 55 2 3.64 10 1 10.00<br />
MAKA 344 8 2.33 161 4 2.48 0 0 0.00<br />
LHOT 376 1 0.27 154 0 0.00 62 0 0.00<br />
EVER 4450 28 0.63 1307 35 2.68 224 4 1.79<br />
CHOY 482 1 0.21 851 6 0.71 20 1 5.00<br />
MANA 257 12 4.67 227 1 0.44 26 0 0.00<br />
ANN1 172 5 2.91 156 10 6.41 67 0 0.00<br />
DHA1 210 9 4.29 241 4 1.66 27 2 7.41<br />
AMAD 104 0 0.00 529 3 0.57 92 0 0.00<br />
BARU 94 0 0.00 150 5 3.33 7 0 0.00<br />
PUMO 87 3 3.45 144 5 3.47 20 1 5.00<br />
Table D-13: Hired deaths <strong>by</strong> season for selected peaks from 1950-2006