

The Himalaya by the Numbers: A Statistical Analysis - Himalayan ...
The Himalaya by the Numbers: A Statistical Analysis - Himalayan ...
The Himalaya by the Numbers: A Statistical Analysis - Himalayan ...

You also want an ePaper? Increase the reach of your titles
YUMPU automatically turns print PDFs into web optimized ePapers that Google loves.
and higher spring death rates on Manaslu and Dhaulagiri I for both members and<br />
hired.<br />
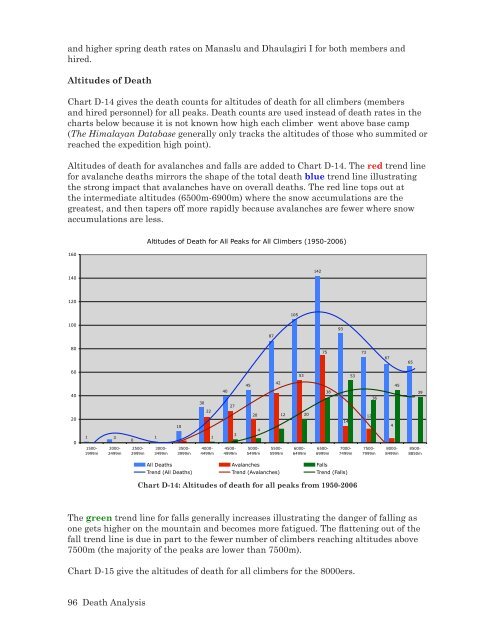
Altitudes of Death<br />
Chart D-14 gives <strong>the</strong> death counts for altitudes of death for all climbers (members<br />
and hired personnel) for all peaks. Death counts are used instead of death rates in <strong>the</strong><br />
charts below because it is not known how high each climber went above base camp<br />
(<strong>The</strong> <strong>Himalaya</strong>n Database generally only tracks <strong>the</strong> altitudes of those who summited or<br />
reached <strong>the</strong> expedition high point).<br />
Altitudes of death for avalanches and falls are added to Chart D-14. <strong>The</strong> red trend line<br />
for avalanche deaths mirrors <strong>the</strong> shape of <strong>the</strong> total death blue trend line illustrating<br />
<strong>the</strong> strong impact that avalanches have on overall deaths. <strong>The</strong> red line tops out at<br />
<strong>the</strong> intermediate altitudes (6500m-6900m) where <strong>the</strong> snow accumulations are <strong>the</strong><br />
greatest, and <strong>the</strong>n tapers off more rapidly because avalanches are fewer where snow<br />
accumulations are less.<br />
160<br />
140<br />
120<br />
100<br />
80<br />
60<br />
40<br />
20<br />
0<br />
1 3<br />
1<br />
0<br />
1500-<br />
1999m<br />
2000-<br />
2499m<br />
2500-<br />
2999m<br />
<strong>The</strong> green trend line for falls generally increases illustrating <strong>the</strong> danger of falling as<br />
one gets higher on <strong>the</strong> mountain and becomes more fatigued. <strong>The</strong> flattening out of <strong>the</strong><br />
fall trend line is due in part to <strong>the</strong> fewer number of climbers reaching altitudes above<br />
7500m (<strong>the</strong> majority of <strong>the</strong> peaks are lower than 7500m).<br />
Chart D-15 give <strong>the</strong> altitudes of death for all climbers for <strong>the</strong> 8000ers.<br />
96 Death <strong>Analysis</strong><br />
Altitudes of Death for All Peaks for All Climbers (1950-2006)<br />
3000-<br />
3499m<br />
10<br />
3500-<br />
3999m<br />
30<br />
22<br />
1<br />
4000-<br />
4499m<br />
40<br />
27<br />
3<br />
4500-<br />
4999m<br />
45<br />
Chart D-14: Altitudes of death for all peaks from 1950-2006<br />
20<br />
4<br />
5000-<br />
5499m<br />
87<br />
42<br />
12<br />
5500-<br />
5999m<br />
105<br />
53<br />
20<br />
6000-<br />
6499m<br />
142<br />
75<br />
38<br />
6500-<br />
6999m<br />
All Deaths Avalanches Falls<br />
93<br />
14<br />
53<br />
7000-<br />
7499m<br />
Trend (All Deaths) Trend (Avalanches) Trend (Falls)<br />
73<br />
12<br />
36<br />
7500-<br />
7999m<br />
67<br />
4<br />
45<br />
8000-<br />
8499m<br />
65<br />
39<br />
8500-<br />
8850m