- Page 1 and 2:
Free translation for information pu
- Page 3 and 4:
TABLE OF CONTENTS (continued) ii Pa
- Page 5 and 6:
TABLE OF CONTENTS (continued) iv Pa
- Page 7 and 8:
TABLE OF CONTENTS (continued) vi Pa
- Page 9 and 10:
SUMMARY OF THE PROSPECTUS Visa n°
- Page 11 and 12:
Key figures from the pro forma inco
- Page 13 and 14:
• The products of the employee an
- Page 15 and 16:
Number of shares 7 Percentage of sh
- Page 17 and 18:
Between the time the customers pay
- Page 19 and 20:
• PrePay Solutions (a joint‐ven
- Page 21 and 22:
specific, it is unlikely that any f
- Page 23 and 24:
The Company also benefits from its
- Page 25 and 26:
1.3 Strategy As an independent comp
- Page 27 and 28:
media to suit products and customer
- Page 29 and 30:
Through the development of these va
- Page 31 and 32:
Issue volume growth is at the cente
- Page 33 and 34:
1.5 Group products and services 1.5
- Page 35 and 36:
The following chart shows the relat
- Page 37 and 38:
(b) Products Tickets Restaurant ®
- Page 39 and 40:
The following table gives an overvi
- Page 41 and 42:
Expense management New Services pro
- Page 43 and 44:
• gift vouchers for businesses an
- Page 45 and 46:
The table below shows the geographi
- Page 47 and 48:
elations given its flexibility and
- Page 49 and 50:
When affiliated merchants accept vo
- Page 51 and 52:
1.10 Competition 1.10.1 The employe
- Page 53 and 54:
1.10.2.3 Growth potential As with t
- Page 55 and 56:
free benefit in kind. This tax bene
- Page 57 and 58:
Restaurant ® beneficiaries secure
- Page 59 and 60:
Key figures from the pro forma inco
- Page 61 and 62:
- breakage revenues from vouchers t
- Page 63 and 64:
A reconciliation between the histor
- Page 65 and 66:
2.4.1.2 Issue volume by business li
- Page 67 and 68:
The proportion of operating revenue
- Page 69 and 70:
esulting from the acquisition of Pr
- Page 71 and 72:
Global structures (1) 0 2 n.s. n.s.
- Page 73 and 74:
The Group’s working capital requi
- Page 75 and 76:
2.6.4 Working capital requirements
- Page 77 and 78:
The Club Deal and the Bilateral Lin
- Page 79 and 80:
2.8.1.1 Europe In the first quarter
- Page 81 and 82:
(in millions of euros) 73 Pro forma
- Page 83 and 84:
Competition The Group’s various b
- Page 85 and 86:
Development of performance products
- Page 87 and 88:
In the past, a large proportion of
- Page 89 and 90:
company, which can be subject to fl
- Page 91 and 92:
These values impact the day‐to‐
- Page 93 and 94:
4.1.2.1 Partners in education For t
- Page 95 and 96:
o Locally, each subsidiary consider
- Page 97 and 98:
On a global scale, the Bernaches: S
- Page 99 and 100:
o Senior support individuals who at
- Page 101 and 102:
Workforce Total number of employees
- Page 103 and 104:
European FOOD (Fighting Obesity thr
- Page 105 and 106:
GREENHOUSE GASES 4.2.2.4 Greenhouse
- Page 107 and 108:
Since 2006, an international employ
- Page 109 and 110:
In the event that the Company’s s
- Page 111 and 112:
Information of the Board of Directo
- Page 113 and 114:
If the Board decides to combine the
- Page 115 and 116:
• validating the categories of ad
- Page 117 and 118:
Organization of work defines and i
- Page 119 and 120:
In addition, without prejudice to t
- Page 121 and 122:
The table below is a summary of the
- Page 123 and 124:
shareholders (other than Accor itse
- Page 125 and 126:
indirectly) from a loan extended by
- Page 127 and 128:
• become “pure players”, list
- Page 129 and 130:
The Company will publish a press re
- Page 131 and 132:
Accordingly, as consideration for t
- Page 133 and 134:
(c) Calculation of the contributed
- Page 135 and 136:
6.3.4.3 Mechanics of the Spinoff Th
- Page 137 and 138:
(f) Impact on the calculation of th
- Page 139 and 140:
SECTION 7 ‐ INFORMATION ABOUT THE
- Page 141 and 142:
of the Company, in respect of share
- Page 143 and 144:
Throughout the subscription period,
- Page 145 and 146:
Because the Company’s shares are
- Page 147 and 148:
connection with their action in con
- Page 149 and 150:
Resolution Purpose of the resolutio
- Page 151 and 152:
“We certify, after taking all rea
- Page 153 and 154:
9.7 Cross‐reference table for inf
- Page 155 and 156:
No. Item in the Regulation Section(
- Page 157 and 158:
No. Item in the Regulation Section(
- Page 159 and 160:
No. Heading in the Regulation Secti
- Page 161 and 162:
No. Heading in the Regulation Secti
- Page 163 and 164:
SECTION 10 FINANCIAL STATEMENTS 10.
- Page 165 and 166:
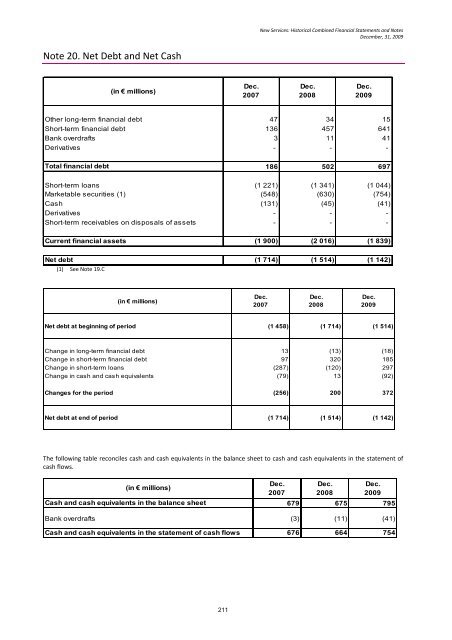
New Services: Historical Combined F
- Page 167 and 168: Equity and Liabilities (in € mill
- Page 169 and 170: Changes in Historical Combined Equi
- Page 171 and 172: 163 New Services: Historical Combin
- Page 173 and 174: 165 New Services: Historical Combin
- Page 175 and 176: Preparation of the financial statem
- Page 177 and 178: 169 New Services: Historical Combin
- Page 179 and 180: 171 New Services: Historical Combin
- Page 181 and 182: 173 New Services: Historical Combin
- Page 183 and 184: 175 New Services: Historical Combin
- Page 185 and 186: S.8. OPERATING PROFIT BEFORE TAX AN
- Page 187 and 188: Note 2. Significant Events and Chan
- Page 189 and 190: New Services: Historical Combined F
- Page 191 and 192: Note 3.3. Operating revenue by geog
- Page 193 and 194: Note 4. Operating Expenses (in €
- Page 195 and 196: Note 6. Depreciation, Amortization
- Page 197 and 198: Note 8. Net financial expense (in
- Page 199 and 200: Note 10. Income Tax Note 10.1. Inco
- Page 201 and 202: Note 10.3. Details of recognized de
- Page 203 and 204: Changes in the carrying amount of g
- Page 205 and 206: The following intangible assets are
- Page 207 and 208: Note 14. Receivables and Payables N
- Page 209 and 210: Note 15. Share‐based payments Not
- Page 211 and 212: New Services: Historical Combined F
- Page 213 and 214: 205 New Services: Historical Combin
- Page 215 and 216: Note 17. Minority Interests (in €
- Page 217: Note 19. Financial debt by Currency
- Page 221 and 222: At December 31, 2008, financial ass
- Page 223 and 224: Note 22. Provisions New Services: H
- Page 225 and 226: - Length‐of‐service awards in I
- Page 227 and 228: Funded status of post‐employment
- Page 229 and 230: Sensitivity analysis 221 New Servic
- Page 231 and 232: New Services: Historical Combined F
- Page 233 and 234: Note 26. Balance sheets by geograph
- Page 235 and 236: Note 27. Claims and Litigation Tax
- Page 237 and 238: Note 29. Additional Information abo
- Page 239 and 240: Note 31. Compensation Paid to Corpo
- Page 241 and 242: Note 33. Subsequent Events There ha
- Page 243 and 244: 10.1.2 Statutory auditor’s report
- Page 245 and 246: Pro forma Income Statements New Ser
- Page 247 and 248: Pro forma Balance Sheets Assets (in
- Page 249 and 250: Pro forma Cash Flows Statements New
- Page 251 and 252: Key Ratios and Indicators New Servi
- Page 253 and 254: 245 New Services: Pro forma Financi
- Page 255 and 256: .2. Equity 247 New Services: Pro fo
- Page 257 and 258: B. At December 31, 2008 (in € mil
- Page 259 and 260: Statements of Comprehensive Income
- Page 261 and 262: B. At December 31, 2008 (in € mil
- Page 263 and 264: Cash Flows Statements A. At Decembe
- Page 265 and 266: C. At December 31, 2009 (in € mil
- Page 267 and 268: Notes to the Pro forma Financial St
- Page 269 and 270:
261 New Services: Pro forma Financi
- Page 271 and 272:
263 New Services: Pro forma Financi
- Page 273 and 274:
D.4. RECOVERABLE AMOUNT OF ASSETS 2
- Page 275 and 276:
K. Pensions and other post‐employ
- Page 277 and 278:
The fair value of the employee bene
- Page 279 and 280:
For all of these products, recogniz
- Page 281 and 282:
U. Segment Information New Services
- Page 283 and 284:
275 New Services: Pro forma Financi
- Page 285 and 286:
Note 3.2. Total revenue Total reven
- Page 287 and 288:
3.3.2 Other operating revenue by ge
- Page 289 and 290:
Note 5. EBITDA by Geographic Segmen
- Page 291 and 292:
Note 7. EBIT by Geographic Segment
- Page 293 and 294:
Note 9. Non‐recurring income and
- Page 295 and 296:
Note 10.2. Effective tax rate New S
- Page 297 and 298:
Note 11. Goodwill (in € millions)
- Page 299 and 300:
Note 12. Intangible Assets New Serv
- Page 301 and 302:
Note 13. Property, Plant and Equipm
- Page 303 and 304:
Note 14.4. Receivables and payables
- Page 305 and 306:
New Services: Pro forma Financial S
- Page 307 and 308:
Employee Stock Ownership Plan 299 N
- Page 309 and 310:
Note 16. Cumulative Fair Value Adju
- Page 311 and 312:
Note 18. Comprehensive Income Tax o
- Page 313 and 314:
Note 19.C Financial instruments 1.
- Page 315 and 316:
Note 21. Provisions New Services: P
- Page 317 and 318:
- Length‐of‐service awards in I
- Page 319 and 320:
Funded status of post‐employment
- Page 321 and 322:
Sensitivity analysis 313 New Servic
- Page 323 and 324:
New Services: Pro forma Financial S
- Page 325 and 326:
Note 25. Balance sheets by geograph
- Page 327 and 328:
Note 26. Claims and Litigation Tax
- Page 329 and 330:
Note 28. Additional Information abo
- Page 331 and 332:
Note 30. Compensation Paid to Corpo
- Page 333 and 334:
Note 32. Subsequent Events There ha
- Page 335 and 336:
10.2.2 Statutory auditor’s report
- Page 337 and 338:
ANNEX A - STATUTORY AUDITORS’ REP
- Page 339 and 340:
appropriate, as well as analyze the
- Page 341 and 342:
The ACCOR S.A. shares are listed on
- Page 343 and 344:
Furthermore, as of the date of this
- Page 345 and 346:
The contribution of assets will als
- Page 347 and 348:
Provisions for risks ..............
- Page 349 and 350:
The new shares will be entirely fun
- Page 351 and 352:
o the execution of a term loan agre
- Page 353 and 354:
are judged appropriate. In particul
- Page 355 and 356:
Within the context of the transacti
- Page 357 and 358:
ANNEX B - STATUTORY APPRAISERS’ R
- Page 359 and 360:
Our report is organized as follows:
- Page 361 and 362:
- All civil, commercial, industrial
- Page 363 and 364:
1.2. Description of the transaction
- Page 365 and 366:
Finally, the contributed net assets
- Page 367 and 368:
Provisions for risks...............
- Page 369 and 370:
- the contribution of assets will b
- Page 371 and 372:
2. WORK PERFORMED AND ASSESSMENT OF
- Page 373 and 374:
c. we have reviewed the financial s
- Page 375 and 376:
2.2.1.2. Separation The ACCOR group
- Page 377 and 378:
i.e., €1,099,185 thousand, repres