Sugarcane ethanol: Contributions to climate change - BAFF
Sugarcane ethanol: Contributions to climate change - BAFF
Sugarcane ethanol: Contributions to climate change - BAFF

Create successful ePaper yourself
Turn your PDF publications into a flip-book with our unique Google optimized e-Paper software.
Chapter 7<br />
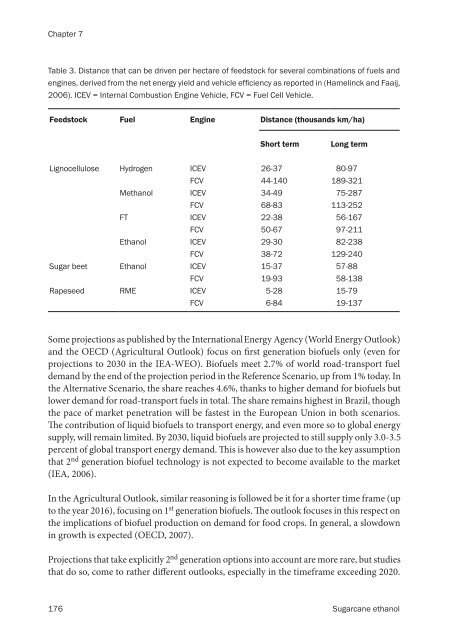
Table 3. Distance that can be driven per hectare of feeds<strong>to</strong>ck for several combinations of fuels and<br />
engines, derived from the net energy yield and vehicle efficiency as reported in (Hamelinck and Faaij,<br />
2006). ICEV = Internal Combustion Engine Vehicle, FCV = Fuel Cell Vehicle.<br />
Feeds<strong>to</strong>ck Fuel Engine Distance (thousands km/ha)<br />
Short term Long term<br />
Lignocellulose Hydrogen ICEV 26-37 80-97<br />
FCV 44-140 189-321<br />
M<strong>ethanol</strong> ICEV 34-49 75-287<br />
FCV 68-83 113-252<br />
FT ICEV 22-38 56-167<br />
FCV 50-67 97-211<br />
Ethanol ICEV 29-30 82-238<br />
FCV 38-72 129-240<br />
Sugar beet Ethanol ICEV 15-37 57-88<br />
FCV 19-93 58-138<br />
Rapeseed RME ICEV 5-28 15-79<br />
FCV 6-84 19-137<br />
Some projections as published by the International Energy Agency (World Energy Outlook)<br />
and the OECD (Agricultural Outlook) focus on �rst generation biofuels only (even for<br />
projections <strong>to</strong> 2030 in the IEA-WEO). Biofuels meet 2.7% of world road-transport fuel<br />
demand by the end of the projection period in the Reference Scenario, up from 1% <strong>to</strong>day. In<br />
the Alternative Scenario, the share reaches 4.6%, thanks <strong>to</strong> higher demand for biofuels but<br />
lower demand for road-transport fuels in <strong>to</strong>tal. �e share remains highest in Brazil, though<br />
the pace of market penetration will be fastest in the European Union in both scenarios.<br />
�e contribution of liquid biofuels <strong>to</strong> transport energy, and even more so <strong>to</strong> global energy<br />
supply, will remain limited. By 2030, liquid biofuels are projected <strong>to</strong> still supply only 3.0-3.5<br />
percent of global transport energy demand. �is is however also due <strong>to</strong> the key assumption<br />
that 2 nd generation biofuel technology is not expected <strong>to</strong> become available <strong>to</strong> the market<br />
(IEA, 2006).<br />
In the Agricultural Outlook, similar reasoning is followed be it for a shorter time frame (up<br />
<strong>to</strong> the year 2016), focusing on 1 st generation biofuels. �e outlook focuses in this respect on<br />
the implications of biofuel production on demand for food crops. In general, a slowdown<br />
in growth is expected (OECD, 2007).<br />
Projections that take explicitly 2 nd generation options in<strong>to</strong> account are more rare, but studies<br />
that do so, come <strong>to</strong> rather di�erent outlooks, especially in the timeframe exceeding 2020.<br />
176 <strong>Sugarcane</strong> <strong>ethanol</strong>