Sugarcane ethanol: Contributions to climate change - BAFF
Sugarcane ethanol: Contributions to climate change - BAFF
Sugarcane ethanol: Contributions to climate change - BAFF

Create successful ePaper yourself
Turn your PDF publications into a flip-book with our unique Google optimized e-Paper software.
Mitigation of GHG emissions using sugarcane bio<strong>ethanol</strong><br />
�e GHG emissions associated with direct land use <strong>change</strong> (LUC) are estimated separately<br />
in the next section, where the possible indirect impacts of land use <strong>change</strong> (ILUC) are also<br />
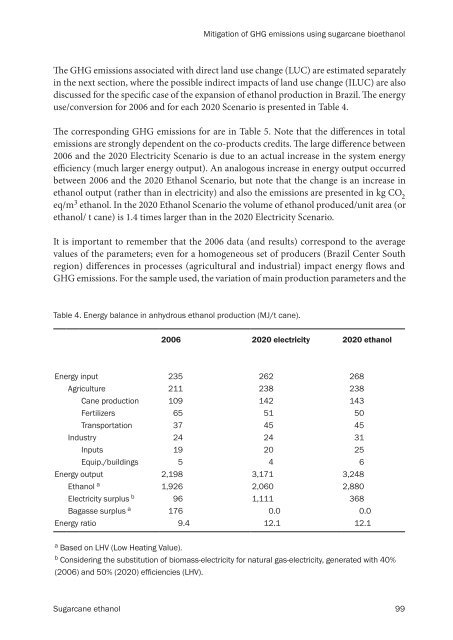
discussed for the speci�c case of the expansion of <strong>ethanol</strong> production in Brazil. �e energy<br />
use/conversion for 2006 and for each 2020 Scenario is presented in Table 4.<br />
�e corresponding GHG emissions for are in Table 5. Note that the di�erences in <strong>to</strong>tal<br />
emissions are strongly dependent on the co-products credits. �e large di�erence between<br />
2006 and the 2020 Electricity Scenario is due <strong>to</strong> an actual increase in the system energy<br />
e�ciency (much larger energy output). An analogous increase in energy output occurred<br />
between 2006 and the 2020 Ethanol Scenario, but note that the <strong>change</strong> is an increase in<br />
<strong>ethanol</strong> output (rather than in electricity) and also the emissions are presented in kg CO 2<br />
eq/m 3 <strong>ethanol</strong>. In the 2020 Ethanol Scenario the volume of <strong>ethanol</strong> produced/unit area (or<br />
<strong>ethanol</strong>/ t cane) is 1.4 times larger than in the 2020 Electricity Scenario.<br />
It is important <strong>to</strong> remember that the 2006 data (and results) correspond <strong>to</strong> the average<br />
values of the parameters; even for a homogeneous set of producers (Brazil Center South<br />
region) di�erences in processes (agricultural and industrial) impact energy �ows and<br />
GHG emissions. For the sample used, the variation of main production parameters and the<br />
Table 4. Energy balance in anhydrous <strong>ethanol</strong> production (MJ/t cane).<br />
2006 2020 electricity 2020 <strong>ethanol</strong><br />
Energy input 235 262 268<br />
Agriculture 211 238 238<br />
Cane production 109 142 143<br />
Fertilizers 65 51 50<br />
Transportation 37 45 45<br />
Industry 24 24 31<br />
Inputs 19 20 25<br />
Equip./buildings 5 4 6<br />
Energy output 2,198 3,171 3,248<br />
Ethanol a 1,926 2,060 2,880<br />
Electricity surplus b 96 1,111 368<br />
Bagasse surplus a 176 0.0 0.0<br />
Energy ratio 9.4 12.1 12.1<br />
a Based on LHV (Low Heating Value).<br />
b Considering the substitution of biomass-electricity for natural gas-electricity, generated with 40%<br />
(2006) and 50% (2020) efficiencies (LHV).<br />
<strong>Sugarcane</strong> <strong>ethanol</strong> 99