- Page 1 and 2:
Sugarcane ethanol Contributions to
- Page 3 and 4:
Table of contents Foreword 11 José
- Page 5:
Chapter 8 �e global impacts of US
- Page 8 and 9:
Foreword �e use of biofuels as a
- Page 11 and 12:
Executive summary Do biofuels help
- Page 13 and 14:
Executive summary 12. Projections o
- Page 15 and 16:
Chapter 1 Introduction to sugarcane
- Page 17 and 18:
Introduction to sugarcane ethanol A
- Page 19 and 20:
Introduction to sugarcane ethanol C
- Page 21 and 22:
Introduction to sugarcane ethanol F
- Page 23:
Introduction to sugarcane ethanol H
- Page 26 and 27:
Chapter 2 Production (million tons)
- Page 28 and 29:
Chapter 2 Table 2. Sugarcane produc
- Page 30 and 31:
Chapter 2 Harvested area (million h
- Page 32 and 33:
Chapter 2 million hectares 8 7 6 5
- Page 34 and 35:
Chapter 2 Table 5. Global significa
- Page 36 and 37:
Chapter 2 (FAOSTAT, 2008). �e lan
- Page 38 and 39:
Chapter 2 indicating that sugarcane
- Page 40 and 41:
Chapter 2 and vinasse produced duri
- Page 42 and 43:
Chapter 2 • • • • Harvested
- Page 44 and 45:
Chapter 2 2.2. AEZ assessment of la
- Page 46 and 47:
Chapter 2 The quantified descriptio
- Page 48 and 49:
Chapter 2 Table 8 summarizes by reg
- Page 50 and 51:
Chapter 2 Table 9. Suitability of u
- Page 52 and 53:
Chapter 2 Table 10. Suitability of
- Page 54 and 55:
Chapter 2 of bio-diversity and land
- Page 56 and 57:
Chapter 2 FAO, 1987. 1948-1985 Worl
- Page 58 and 59:
Chapter 2 Smeets, E., M. Junginger,
- Page 60 and 61:
Chapter 3 Considering that this deb
- Page 62 and 63:
Chapter 3 1,000 ha 9,000 8,000 7,00
- Page 64 and 65:
Chapter 3 Another source of data on
- Page 66 and 67:
Chapter 3 Figure 3. Different land
- Page 68 and 69:
Chapter 3 1-Pastureand crops expans
- Page 70 and 71:
Chapter 3 Given that the model is u
- Page 72 and 73:
Chapter 3 to the case studies; (d)
- Page 74 and 75:
Chapter 3 Mato Grosso do Sul in 200
- Page 76 and 77:
Chapter 3 the Pasture class increas
- Page 78 and 79:
Chapter 3 Table 5. Number of sugarc
- Page 80 and 81:
Chapter 3 of 12.6% from 2001 to 200
- Page 82 and 83:
Chapter 3 Table 6. South-Centre: ex
- Page 84 and 85:
Chapter 3 4.5. Options for approach
- Page 86 and 87:
Chapter 3 states that have lost pas
- Page 88 and 89:
Chapter 3 It is important to contex
- Page 91 and 92:
Chapter 4 Mitigation of GHG emissio
- Page 93 and 94:
Table 1. Basic data: sugarcane prod
- Page 95 and 96:
Mitigation of GHG emissions using s
- Page 97 and 98:
GHG emission (kg CO 2 eq/m 3 etOH)
- Page 99 and 100:
Mitigation of GHG emissions using s
- Page 101 and 102:
Table 7. Soil carbon content for di
- Page 103 and 104:
Mitigation of GHG emissions using s
- Page 105 and 106:
5. Conclusions Mitigation of GHG em
- Page 107:
Mitigation of GHG emissions using s
- Page 110 and 111:
Chapter 5 Oil reserves - Gasoline/d
- Page 112 and 113:
Chapter 5 in research and developme
- Page 114 and 115:
Chapter 5 Table 3. Summary of main
- Page 116 and 117:
Chapter 5 3. Environmental indicato
- Page 118 and 119:
Chapter 5 Table 4. Carbon stock in
- Page 120 and 121:
Chapter 5 3.2. Water Total carbon i
- Page 122 and 123:
Chapter 5 3.3. Soil and fertilizers
- Page 124 and 125:
Chapter 5 3.4. Management of diseas
- Page 126 and 127:
Chapter 5 Table 10. Sugarcane and v
- Page 128 and 129:
Chapter 5 in the implementation of
- Page 130 and 131:
Chapter 5 Table 11. Continued. Crit
- Page 132 and 133:
Chapter 5 Brazilian Government. Lei
- Page 134 and 135:
Chapter 5 São Paulo State Governme
- Page 136 and 137:
Chapter 6 2. Development of the eth
- Page 138 and 139:
Chapter 6 blends by car manufacture
- Page 140 and 141:
Chapter 6 Brazil have been roughly
- Page 142 and 143:
Chapter 6 Overall there are few di
- Page 144 and 145:
Chapter 6 3.2.1. The impact of exis
- Page 146 and 147:
Chapter 6 �e use of ethanol in he
- Page 148 and 149:
Chapter 6 cropping systems that pro
- Page 150 and 151:
Chapter 6 certainty, the supply of
- Page 152 and 153:
Chapter 6 De Vries, B.J.M., D.P. va
- Page 155 and 156:
Chapter 7 Biofuel conversion techno
- Page 157 and 158:
Biofuel conversion technologies �
- Page 159 and 160:
Biofuel conversion technologies In
- Page 161 and 162:
Biofuel conversion technologies the
- Page 163 and 164:
Biofuel conversion technologies Imp
- Page 165 and 166:
Biofuel conversion technologies Pro
- Page 167 and 168:
Investment costs (Euro/kWth input c
- Page 169 and 170:
4.2. Greenhouse gas balances Biofue
- Page 171 and 172:
Reduction in CO equivalent emission
- Page 173 and 174:
Biofuel conversion technologies �
- Page 175 and 176:
Biofuel conversion technologies pot
- Page 177 and 178: Chapter 8 The global impacts of US
- Page 179 and 180: The global impacts of US and EU bio
- Page 181 and 182: The global impacts of US and EU bio
- Page 183 and 184: The global impacts of US and EU bio
- Page 185 and 186: The global impacts of US and EU bio
- Page 187 and 188: Table 1. Change in output due to EU
- Page 189 and 190: The global impacts of US and EU bio
- Page 191 and 192: Forest cover Pasture cover USEU 201
- Page 193: The global impacts of US and EU bio
- Page 196 and 197: Chapter 9 also risks and serious tr
- Page 198 and 199: Chapter 9 Box 2. Bioethanol stoves
- Page 200 and 201: Chapter 9 �e highest impact on po
- Page 202 and 203: Chapter 9 the increased generation
- Page 204 and 205: Chapter 9 o�ers to support the MD
- Page 206 and 207: Chapter 9 Price variation (%) 14 12
- Page 208 and 209: Chapter 9 Dufey et al., 2007a). Leg
- Page 210 and 211: Chapter 9 manufactured directly fro
- Page 212 and 213: Chapter 9 in mechanical aid for the
- Page 214 and 215: Chapter 9 Table 1. Import tariffs o
- Page 216 and 217: Chapter 9 3.8. Improving efficiency
- Page 218 and 219: Chapter 9 some minimum transport in
- Page 220 and 221: Chapter 9 IEA, 2004. Biofuels for T
- Page 223 and 224: Chapter 10 Why are current food pri
- Page 225 and 226: Why are current food prices so high
- Page 227: 2.4 Long-term drivers of supply Why
- Page 231 and 232: 3.3 Policy responses to rising food
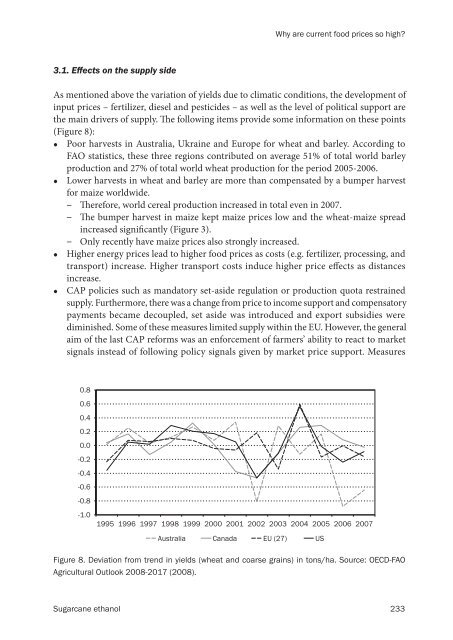
- Page 233 and 234: 3.4. Other effects • Why are curr
- Page 235 and 236: - - - - Why are current food prices
- Page 237 and 238: 18 16 14 12 10 8 6 4 2 0 5. The fut
- Page 239 and 240: • • • Why are current food pr
- Page 241 and 242: 6.1. Policy implications Why are cu
- Page 243: Why are current food prices so high
- Page 247 and 248: Authors Dr. Marcos Adami, senior re
- Page 249 and 250: Keyword index A Africa 204, 205, 20
- Page 251: M maize 20, 83, 104, 173, 184, 187,