essays in public finance and industrial organization a dissertation ...
essays in public finance and industrial organization a dissertation ...
essays in public finance and industrial organization a dissertation ...

Create successful ePaper yourself
Turn your PDF publications into a flip-book with our unique Google optimized e-Paper software.
CHAPTER 4. YEAR-END SPENDING 184<br />
20 25 30 35<br />
Last quarter spend<strong>in</strong>g (percent)<br />
Non-defense<br />
2005<br />
2001<br />
2007<br />
2004<br />
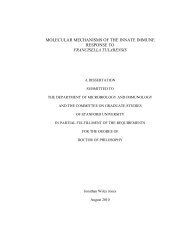
Figure 4.2: Year-End Spend<strong>in</strong>g by Appropriations Date<br />
2003<br />
2006<br />
2008<br />
2002<br />
2000<br />
2000<br />
2005<br />
2008<br />
2001<br />
2006<br />
2002<br />
2004<br />
2007<br />
2003<br />
2009<br />
Defense<br />
-10 0 10 20 30<br />
Weeks late<br />
2009<br />
Non-defense slope = .193 (.094)<br />
Defense slope = .180 (.053)<br />
Pooled slope = .183 (.044)<br />
(a) Last Quarter Spend<strong>in</strong>g<br />
6 8 10 12 14 16<br />
Last week spend<strong>in</strong>g (percent)<br />
Non-defense slope = .112 (.146)<br />
Defense slope = .081 (.045)<br />
Pooled slope = .089 (.047)<br />
2005<br />
2007<br />
Defense<br />
2004<br />
2006<br />
2008<br />
2005<br />
10 15 20<br />
Last month spend<strong>in</strong>g (percent)<br />
2008<br />
2006<br />
2001<br />
2005<br />
Non-defense<br />
2006<br />
2003<br />
2007<br />
2004<br />
2008<br />
2002<br />
2008<br />
2000<br />
20052001<br />
2006<br />
2000<br />
2002<br />
2004<br />
2003<br />
2007<br />
2009<br />
Defense<br />
-10 0 10 20 30<br />
Weeks late<br />
2004<br />
2007<br />
2009<br />
Non-defense slope = .130 (.078)<br />
Defense slope = .089 (.030)<br />
Pooled slope = .100 (.029)<br />
(b) Last Month Spend<strong>in</strong>g<br />
Non-defense<br />
-10 0 10 20 30<br />
Weeks late<br />
(c) Last Week Spend<strong>in</strong>g<br />
Source: Federal Procurement Data System, accessed October, 2010 via<br />
www.usaspend<strong>in</strong>g.gov <strong>and</strong> Library of Congress.<br />
Note: Vertical axes show the percent of annual spend<strong>in</strong>g occur<strong>in</strong>g <strong>in</strong> the last quarter,<br />
month, <strong>and</strong> week of the fiscal year. Horizontal axes shows the passage dates for the<br />
non-defense <strong>and</strong> defense appropriation bills, relative to the first day of the fiscal year <strong>in</strong><br />
weeks. For defense spend<strong>in</strong>g, weeks late measures the date that the defense appropriations<br />
bill was enacted. For non-defense spend<strong>in</strong>g the date is assigned from the date of the<br />
consolidated appropriations act, or, <strong>in</strong> the case of the two years <strong>in</strong> which there was not a<br />
consolidated act, a date that is the midpo<strong>in</strong>t of the <strong>in</strong>dividual non-defense appropriations<br />
acts. Plots show fitted l<strong>in</strong>es <strong>and</strong> slope coefficients from bivariate regressions on defense<br />
<strong>and</strong> non-defense spend<strong>in</strong>g. Pooled coefficients from a regression where defense <strong>and</strong><br />
non-defense spend<strong>in</strong>g have different <strong>in</strong>tercepts but are constra<strong>in</strong>ed to have the same slope.<br />
Robust st<strong>and</strong>ard errors <strong>in</strong> parentheses.<br />
2009<br />
2009