essays in public finance and industrial organization a dissertation ...
essays in public finance and industrial organization a dissertation ...
essays in public finance and industrial organization a dissertation ...

You also want an ePaper? Increase the reach of your titles
YUMPU automatically turns print PDFs into web optimized ePapers that Google loves.
50 60 70 80 90 100<br />
Insurance coverage (percentage po<strong>in</strong>ts)<br />
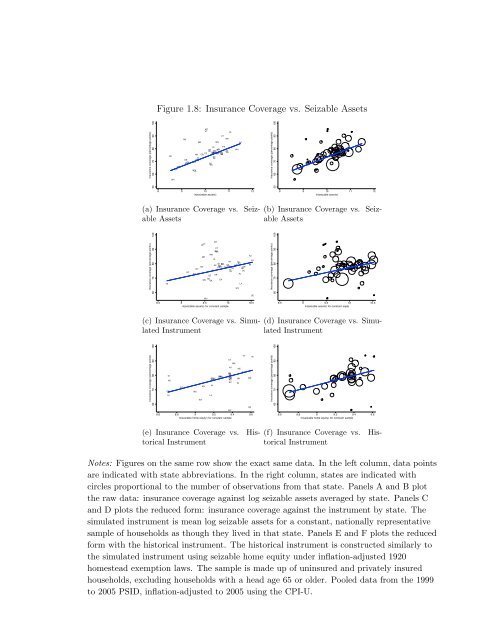
Figure 1.8: Insurance Coverage vs. Seizable Assets<br />
ND<br />
ME<br />
MT<br />
VT<br />
MN<br />
CT<br />
MA<br />
AK<br />
AL<br />
AR AZ<br />
IA PA<br />
DC<br />
MS<br />
DE<br />
KS<br />
OK<br />
WI NY KY<br />
TN MO<br />
GA ID<br />
CO IL<br />
VA NMUT NV MD MI<br />
NH<br />
NC OH<br />
OR<br />
NE HI<br />
SC<br />
FL<br />
IN<br />
SD<br />
CA<br />
WA<br />
TX<br />
WY LA<br />
WV<br />
8 9 10 11 12<br />
ln(seizable assets)<br />
(a) Insurance Coverage vs. Seizable<br />
Assets<br />
60 70 80 90 100<br />
Insurance coverage (percentage po<strong>in</strong>ts)<br />
TX<br />
MT<br />
VT<br />
RI<br />
CT<br />
ND MA<br />
ME<br />
MN<br />
NJ<br />
IA<br />
DC<br />
NH<br />
NV<br />
KS<br />
NY TN<br />
WI WA ID<br />
KY<br />
AK<br />
GA IL<br />
NM<br />
CO MD<br />
MO<br />
VA OR UT<br />
OH<br />
NC NE<br />
FL<br />
HI<br />
IN<br />
SC<br />
AL<br />
AZ<br />
AR<br />
PA<br />
MI<br />
SD<br />
MS OK<br />
WV<br />
8.5 9 9.5 10 10.5<br />
ln(seizable assets) for constant sample<br />
(c) Insurance Coverage vs. Simulated<br />
Instrument<br />
60 70 80 90 100<br />
Insurance coverage (percentage po<strong>in</strong>ts)<br />
ID<br />
NV<br />
GAMI<br />
MO<br />
CO VAUT<br />
NE<br />
NY TN<br />
KY WA IL<br />
NM<br />
OH<br />
NC<br />
SC<br />
PA<br />
NH<br />
IN<br />
MD<br />
AZ<br />
AR<br />
AL<br />
CA<br />
TX<br />
MS<br />
WY<br />
8.6 8.8 9 9.2 9.4 9.6<br />
ln(seizable home equity) for constant sample<br />
(e) Insurance Coverage vs. Historical<br />
Instrument<br />
LA<br />
CA<br />
RI<br />
CT<br />
NJ<br />
WV<br />
MA<br />
WY<br />
NJ<br />
ME<br />
LA<br />
VT<br />
DE<br />
DE<br />
RI<br />
50 60 70 80 90 100<br />
Insurance coverage (percentage po<strong>in</strong>ts)<br />
8 9 10 11 12<br />
ln(seizable assets)<br />
(b) Insurance Coverage vs. Seizable<br />
Assets<br />
60 70 80 90 100<br />
Insurance coverage (percentage po<strong>in</strong>ts)<br />
8.5 9 9.5 10 10.5<br />
ln(seizable assets) for constant saple<br />
(d) Insurance Coverage vs. Simulated<br />
Instrument<br />
60 70 80 90 100<br />
Insurance coverage (percentage po<strong>in</strong>ts)<br />
8.6 8.8 9 9.2 9.4 9.6<br />
ln(seizable home equity) for constant sample<br />
(f) Insurance Coverage vs. Historical<br />
Instrument<br />
Notes: Figures on the same row show the exact same data. In the left column, data po<strong>in</strong>ts<br />
are <strong>in</strong>dicated with state abbreviations. In the right column, states are <strong>in</strong>dicated with<br />
circles proportional to the number of observations from that state. Panels A <strong>and</strong> B plot<br />
the raw data: <strong>in</strong>surance coverage aga<strong>in</strong>st log seizable assets averaged by state. Panels C<br />
<strong>and</strong> D plots the reduced form: <strong>in</strong>surance coverage aga<strong>in</strong>st the <strong>in</strong>strument by state. The<br />
simulated <strong>in</strong>strument is mean log seizable assets for a constant, nationally representative<br />
sample of households as though they lived <strong>in</strong> that state. Panels E <strong>and</strong> F plots the reduced<br />
form with the historical <strong>in</strong>strument. The historical <strong>in</strong>strument is constructed similarly to<br />
the simulated <strong>in</strong>strument us<strong>in</strong>g seizable home equity under <strong>in</strong>flation-adjusted 1920<br />
homestead exemption laws. The sample is made up of un<strong>in</strong>sured <strong>and</strong> privately <strong>in</strong>sured<br />
households, exclud<strong>in</strong>g households with a head age 65 or older. Pooled data from the 1999<br />
to 2005 PSID, <strong>in</strong>flation-adjusted to 2005 us<strong>in</strong>g the CPI-U.