PIC16F8X, 18-Pin FLASH/EEPROM 8-Bit MCU Data Sheet - Microchip
PIC16F8X, 18-Pin FLASH/EEPROM 8-Bit MCU Data Sheet - Microchip
PIC16F8X, 18-Pin FLASH/EEPROM 8-Bit MCU Data Sheet - Microchip

Create successful ePaper yourself
Turn your PDF publications into a flip-book with our unique Google optimized e-Paper software.
13.0 DC & AC CHARACTERISTICS GRAPHS/TABLES<br />
<strong>PIC16F8X</strong><br />
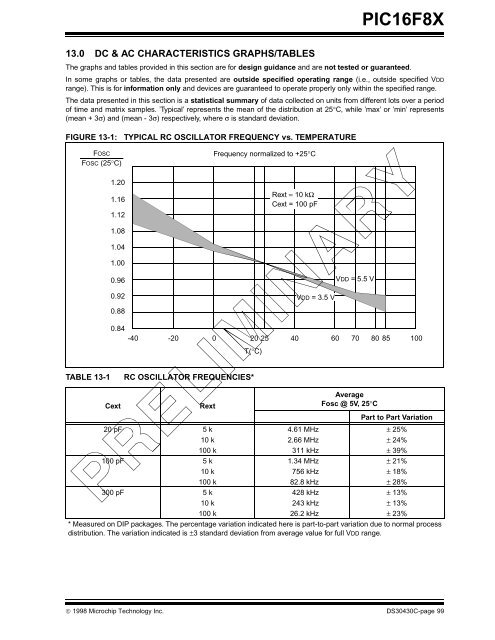
The graphs and tables provided in this section are for design guidance and are not tested or guaranteed.<br />
In some graphs or tables, the data presented are outside specified operating range (i.e., outside specified VDD<br />
range). This is for information only and devices are guaranteed to operate properly only within the specified range.<br />
The data presented in this section is a statistical summary of data collected on units from different lots over a period<br />
of time and matrix samples. ’Typical’ represents the mean of the distribution at 25°C, while ’max’ or ’min’ represents<br />
(mean + 3σ) and (mean - 3σ) respectively, where σ is standard deviation.<br />
FIGURE 13-1: TYPICAL RC OSCILLATOR FREQUENCY vs. TEMPERATURE<br />
FOSC<br />
FOSC (25°C)<br />
1.20<br />
1.16<br />
1.12<br />
1.08<br />
1.04<br />
1.00<br />
0.96<br />
0.92<br />
0.88<br />
0.84<br />
-40 -20 0 20 25<br />
T(°C)<br />
40 60 70 80 85<br />
100<br />
TABLE 13-1 RC OSCILLATOR FREQUENCIES*<br />
Frequency normalized to +25°C<br />
Rext = 10 kΩ<br />
Cext = 100 pF<br />
VDD = 3.5 V<br />
VDD = 5.5 V<br />
Cext Rext<br />
Average<br />
Fosc @ 5V, 25°C<br />
Part to Part Variation<br />
20 pF 5 k 4.61 MHz ± 25%<br />
10 k 2.66 MHz ± 24%<br />
100 k 311 kHz ± 39%<br />
100 pF 5 k 1.34 MHz ± 21%<br />
10 k 756 kHz ± <strong>18</strong>%<br />
100 k 82.8 kHz ± 28%<br />
300 pF 5 k 428 kHz ± 13%<br />
10 k 243 kHz ± 13%<br />
100 k 26.2 kHz ± 23%<br />
* Measured on DIP packages. The percentage variation indicated here is part-to-part variation due to normal process<br />
distribution. The variation indicated is ±3 standard deviation from average value for full VDD range.<br />
© 1998 <strong>Microchip</strong> Technology Inc. DS30430C-page 99