Pierre River Mine Project
Pierre River Mine Project
Pierre River Mine Project
- TAGS
- pierre
- river
- project
- www.ceaa.gc.ca

Create successful ePaper yourself
Turn your PDF publications into a flip-book with our unique Google optimized e-Paper software.
WATER AENV SIRS 15 – 43<br />
Air temperature<br />
Precipitation<br />
Solar radiation<br />
Wind<br />
Data Type Name of Data Set Data Source<br />
Fort McMurray airport climate station<br />
(1944–2006)<br />
Environment<br />
Canada<br />
Fort McMurray climate station (1919-1944) Environment<br />
Canada<br />
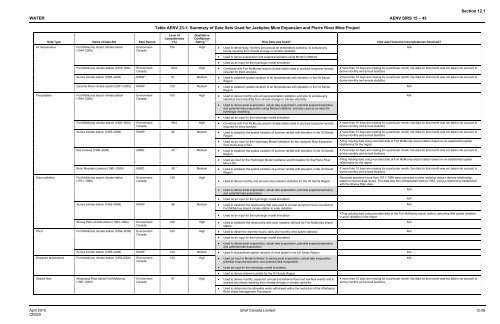
Table AENV 23-1: Summary of Data Sets Used for Jackpine <strong>Mine</strong> Expansion and <strong>Pierre</strong> <strong>River</strong> <strong>Mine</strong> <strong>Project</strong><br />
Level of<br />
Completeness<br />
(%)<br />
100 High<br />
Qualitative<br />
Confidence<br />
Rating 1, 2 How Data was Used? How was Historical Incompleteness Resolved?<br />
• Used to derive daily, monthly and annual air temperature statistics, to analyze any<br />
trends resulting from climate change or climate variability<br />
• Used to derive evaporation and evapotranspiration using Morton's Method<br />
• Used as an input for the hydrologic model simulation<br />
99.5 High • Combined with Fort McMurray airport climate station data to produce long-term records<br />
required for trend analysis<br />
Aurora climate station (1995–2006) RAMP 91 Medium • Used to establish spatial variation of air temperatures with elevation in the Oil Sands<br />
Region<br />
Calumet <strong>River</strong> climate station (2001–2005) RAMP 100 Medium • Used to establish spatial variation of air temperatures with elevation in the Oil Sands<br />
Region<br />
Fort McMurray airport climate station<br />
(1944–2006)<br />
Environment<br />
Canada<br />
Fort McMurray climate station (1920-1944) Environment<br />
Canada<br />
100 High<br />
Aurora climate station (1995–2006) RAMP 98 Medium<br />
Ells Lookout (1960–2006) ASRD 32 3 Medium<br />
• Used to derive monthly and annual precipitation statistics, and also to analyze any<br />
statistical trend resulting from climate change or climate variability<br />
• Used to derive areal evaporation, actual lake evaporation, potential evapotranspiration,<br />
and potential lake evaporation using Morton's Method, and also used as an input for<br />
hydrologic modelling<br />
• Used as an input for the hydrologic model simulation<br />
99.5 High • Combined with Fort McMurray airport climate station data to produce long-term records<br />
required for trend analysis<br />
• Used to establish the spatial variation of summer rainfall with elevation in the Oil Sands<br />
Region<br />
• Used as an input for the Hydrologic Model Validation for the Jackpine <strong>Mine</strong> Expansion<br />
local study area (LSA)<br />
• Used to establish the spatial variation of summer rainfall with elevation in the Oil Sands<br />
Region<br />
• Used as input for the Hydrologic Model Validation and Simulation for the <strong>Pierre</strong> <strong>River</strong><br />
<strong>Mine</strong> LSA<br />
Birch Mountain Lookout (1961–2006) ASRD 38 3 Medium • Used to establish the spatial variation of summer rainfall with elevation in the Oil Sands<br />
Region<br />
Fort McMurray airport climate station<br />
(1971–1996)<br />
Environment<br />
Canada<br />
100 High<br />
Aurora climate station (1995–2006) RAMP 98 Medium<br />
Stoney Plain climate station (1953–1994) Environment<br />
Canada<br />
Fort McMurray climate station (1959–2006) Environment<br />
Canada<br />
• Used to derive monthly and annual solar radiation statistics for the Oil Sands Region<br />
• Used to derive areal evaporation, actual lake evaporation, potential evapotranspiration,<br />
and potential lake evaporation<br />
Section 12.1<br />
April 2010 Shell Canada Limited 12-28<br />
CR029<br />
N/A<br />
If more than 10 days are missing for a particular month, the data for that month was not taken into account to<br />
derive monthly and annual statistics<br />
If more than 10 days are missing for a particular month, the data for that month was not taken into account to<br />
derive monthly and annual statistics<br />
N/A<br />
N/A<br />
If more than 10 days are missing for a particular month, the data for that month was not taken into account to<br />
derive monthly and annual statistics<br />
If more than 10 days are missing for a particular month, the data for that month was not taken into account to<br />
derive monthly and annual statistics<br />
Filling missing data using recorded data at Fort McMurray airport station based on an established spatial<br />
relationship for the region<br />
If more than 10 days are missing for a particular month, the data for that month was not taken into account to<br />
derive monthly and annual statistics<br />
Recorded sunshine hours from 1971–1996 were converted to solar radiation using a derived relationship<br />
based on Aurora data review. The data was then extrapolated back to 1953, using a relationship established<br />
with the Stoney Plain data.<br />
• Used as an input for the hydrologic model simulation N/A<br />
• Used to establish the relationship that was used to convert sunshine hours recorded at<br />
Fort McMurray airport climate station to solar radiation<br />
• Used as an input for the hydrologic model simulation<br />
100 High • Used to establish the relationship with solar radiation derived for Fort McMurray airport<br />
station<br />
100 High<br />
N/A<br />
N/A<br />
Filling missing data using recorded data at the Fort McMurray airport station, assuming little spatial variation<br />
in solar radiation in the region<br />
• Used to determine extreme hourly, daily and monthly wind speed statistics N/A<br />
• Used as an input for the hydrologic model simulation<br />
• Used to derive areal evaporation, actual lake evaporation, potential evapotranspiration,<br />
and potential lake evaporation<br />
Aurora climate station (1995–2006) RAMP 100 Medium • Used to characterize spatial variation of wind speed in the Oil Sands Region N/A<br />
Dewpoint temperature Fort McMurray climate station (1953-2006) Environment<br />
Canada<br />
Stream flow Athabasca <strong>River</strong> below Fort McMurray<br />
(1957–2006)<br />
Environment<br />
Canada<br />
100 High<br />
97 High<br />
• Used as input to Morton's Model to derive areal evaporation, actual lake evaporation,<br />
potential evapotranspiration, and potential lake evaporation<br />
• Used as input for the hydrologic model simulation<br />
• Used to derive relative humidity for the Oil Sands Region<br />
• Used to derive monthly, seasonal, annual and extreme flood and low-flow events and to<br />
analyze any trends resulting from climate change or climate variability<br />
• Used to determine the allowable water withdrawal within the restriction of the Athabasca<br />
<strong>River</strong> Water Management Framework<br />
N/A<br />
N/A<br />
If more than 10 days are missing for a particular month, the data for that month was not taken into account to<br />
derive monthly and annual statistics