- Page 1 and 2:
Application for Approval of the Pie
- Page 4 and 5:
PIERRE RIVER MINE SUPPLEMENTAL INFO
- Page 6 and 7:
PIERRE RIVER MINE SUPPLEMENTAL INFO
- Page 8 and 9:
CONTENTS LIST OF ILLUSTRATIONS Tabl
- Page 10 and 11:
PIERRE RIVER MINE SUPPLEMENTAL INFO
- Page 12 and 13:
INTRODUCTION OVERVIEW Table 1-1: Gu
- Page 14 and 15:
PIERRE RIVER MINE SUPPLEMENTAL INFO
- Page 16 and 17:
INTRODUCTION NAVIGABLE WATERS Secti
- Page 18 and 19:
INTRODUCTION NAVIGABLE WATERS Secti
- Page 20 and 21:
PIERRE RIVER MINE SUPPLEMENTAL INFO
- Page 22 and 23:
PIERRE RIVER MINE SUPPLEMENTAL INFO
- Page 24 and 25:
PIERRE RIVER MINE SUPPLEMENTAL INFO
- Page 26 and 27:
Section 2.2 ERRATA EIA, EIA UPDATE
- Page 28 and 29:
Section 2.2 ERRATA EIA, EIA UPDATE
- Page 30 and 31:
PIERRE RIVER MINE SUPPLEMENTAL INFO
- Page 32 and 33:
Section 2.3 ERRATA SUPPLEMENTAL INF
- Page 34 and 35:
Section 2.3 ERRATA SUPPLEMENTAL INF
- Page 36 and 37:
PIERRE RIVER MINE SUPPLEMENTAL INFO
- Page 38 and 39:
PIERRE RIVER MINE SUPPLEMENTAL INFO
- Page 40 and 41:
MINING AND PROCESSING ERCB SIRS 3 -
- Page 42 and 43:
MINING AND PROCESSING ERCB SIRS 3 -
- Page 44 and 45:
MINING AND PROCESSING ERCB SIRS 3 -
- Page 46 and 47:
MINING AND PROCESSING ERCB SIRS 3 -
- Page 48 and 49:
MINING AND PROCESSING ERCB SIRS 3 -
- Page 50 and 51:
MINING AND PROCESSING ERCB SIRS 3 -
- Page 52 and 53:
MINING AND PROCESSING ERCB SIRS 3 -
- Page 54 and 55:
MINING AND PROCESSING ERCB SIRS 3 -
- Page 56 and 57:
MINING AND PROCESSING ERCB SIRS 3 -
- Page 58 and 59:
MINING AND PROCESSING ERCB SIRS 3 -
- Page 60 and 61:
MINING AND PROCESSING ERCB SIRS 3 -
- Page 62 and 63:
MINING AND PROCESSING ERCB SIRS 3 -
- Page 64 and 65:
MINING AND PROCESSING ERCB SIRS 3 -
- Page 66 and 67:
MINING AND PROCESSING ERCB SIRS 3 -
- Page 68 and 69:
MINING AND PROCESSING ERCB SIRS 3 -
- Page 70 and 71:
MINING AND PROCESSING ERCB SIRS 3 -
- Page 72 and 73:
MINING AND PROCESSING ERCB SIRS 3 -
- Page 74 and 75:
MINING AND PROCESSING ERCB SIRS 3 -
- Page 76 and 77:
MINING AND PROCESSING ERCB SIRS 3 -
- Page 78 and 79:
PIERRE RIVER MINE SUPPLEMENTAL INFO
- Page 80 and 81:
PIERRE RIVER MINE SUPPLEMENTAL INFO
- Page 82 and 83:
AIR ERCB SIRS 40 - 45 Request 41b B
- Page 84 and 85:
AIR ERCB SIRS 40 - 45 Table ERCB 41
- Page 86 and 87:
AIR ERCB SIRS 40 - 45 Community Tab
- Page 88 and 89:
AIR ERCB SIRS 40 - 45 Community Tab
- Page 90 and 91:
AIR ERCB SIRS 40 - 45 Section 6.1 T
- Page 92 and 93:
AIR ERCB SIRS 40 - 45 Section 6.1 T
- Page 94 and 95:
AIR ERCB SIRS 40 - 45 Local Study A
- Page 96 and 97:
AIR ERCB SIRS 40 - 45 Section 6.1 F
- Page 98 and 99:
AIR ERCB SIRS 40 - 45 Section 6.1 F
- Page 100 and 101:
AIR ERCB SIRS 40 - 45 Question No.
- Page 102 and 103:
AIR ERCB SIRS 40 - 45 Question No.
- Page 104 and 105:
PIERRE RIVER MINE SUPPLEMENTAL INFO
- Page 106 and 107:
WATER ERCB SIRS 46 - 79 Section 7.1
- Page 108 and 109:
WATER ERCB SIRS 46 - 79 Question No
- Page 110 and 111:
WATER ERCB SIRS 46 - 79 Section 7.1
- Page 112 and 113:
WATER ERCB SIRS 46 - 79 Section 7.1
- Page 114 and 115:
WATER ERCB SIRS 46 - 79 Section 7.1
- Page 116 and 117:
WATER ERCB SIRS 46 - 79 Question No
- Page 118 and 119:
WATER ERCB SIRS 46 - 79 Section 7.1
- Page 120 and 121:
WATER ERCB SIRS 46 - 79 Section 7.1
- Page 122 and 123:
WATER ERCB SIRS 46 - 79 Section 7.1
- Page 124 and 125:
WATER ERCB SIRS 46 - 79 References
- Page 126 and 127:
WATER ERCB SIRS 46 - 79 Section 7.1
- Page 128 and 129:
WATER ERCB SIRS 46 - 79 Section 7.1
- Page 130 and 131:
WATER ERCB SIRS 46 - 79 Question No
- Page 132 and 133:
WATER ERCB SIRS 46 - 79 Reference S
- Page 134 and 135:
WATER ERCB SIRS 46 - 79 Section 7.1
- Page 136 and 137:
WATER ERCB SIRS 46 - 79 Section 7.1
- Page 138 and 139:
WATER ERCB SIRS 46 - 79 Section 7.1
- Page 140 and 141:
WATER ERCB SIRS 46 - 79 References
- Page 142 and 143:
PIERRE RIVER MINE SUPPLEMENTAL INFO
- Page 144 and 145:
PIERRE RIVER MINE SUPPLEMENTAL INFO
- Page 146 and 147:
PIERRE RIVER MINE SUPPLEMENTAL INFO
- Page 148 and 149:
GENERAL AENV SIRS 1 - 5 Figure AENV
- Page 150 and 151:
GENERAL AENV SIRS 1 - 5 Question No
- Page 152 and 153:
GENERAL AENV SIRS 1 - 5 Solid Secti
- Page 154 and 155:
PIERRE RIVER MINE SUPPLEMENTAL INFO
- Page 156 and 157:
AIR AENV SIRS 6 - 14 Question No. 7
- Page 158 and 159:
AIR AENV SIRS 6 - 14 Section 11.1 R
- Page 160 and 161:
AIR AENV SIRS 6 - 14 Vehicle Emissi
- Page 162 and 163:
AIR AENV SIRS 6 - 14 Question No. 1
- Page 164 and 165:
AIR AENV SIRS 6 - 14 Section 11.1 R
- Page 166 and 167:
AIR AENV SIRS 6 - 14 Section 11.1 R
- Page 168 and 169:
AIR AENV SIRS 6 - 14 References Sec
- Page 170 and 171:
PIERRE RIVER MINE SUPPLEMENTAL INFO
- Page 172 and 173:
WATER AENV SIRS 15 - 43 Section 12.
- Page 174 and 175:
WATER AENV SIRS 15 - 43 Section 12.
- Page 176 and 177:
WATER AENV SIRS 15 - 43 ii. What wa
- Page 178 and 179:
WATER AENV SIRS 15 - 43 The typical
- Page 180 and 181:
WATER AENV SIRS 15 - 43 Reference S
- Page 182 and 183:
WATER AENV SIRS 15 - 43 Section 12.
- Page 184 and 185:
WATER AENV SIRS 15 - 43 References
- Page 186 and 187:
WATER AENV SIRS 15 - 43 References
- Page 188 and 189:
WATER AENV SIRS 15 - 43 Decay Rates
- Page 190 and 191:
WATER AENV SIRS 15 - 43 Section 12.
- Page 192 and 193:
WATER AENV SIRS 15 - 43 Question No
- Page 194 and 195:
WATER AENV SIRS 15 - 43 Section 12.
- Page 196 and 197:
WATER AENV SIRS 15 - 43 Section 12.
- Page 198 and 199:
WATER AENV SIRS 15 - 43 Data Type N
- Page 200 and 201:
WATER AENV SIRS 15 - 43 Figure AENV
- Page 202 and 203:
WATER AENV SIRS 15 - 43 Section 12.
- Page 204 and 205:
WATER AENV SIRS 15 - 43 Section 12.
- Page 206 and 207:
WATER AENV SIRS 15 - 43 Section 12.
- Page 208 and 209:
WATER AENV SIRS 15 - 43 Figure AENV
- Page 210 and 211:
WATER AENV SIRS 15 - 43 Question No
- Page 212 and 213:
WATER AENV SIRS 15 - 43 • tempera
- Page 214 and 215:
WATER AENV SIRS 15 - 43 Reference Q
- Page 216 and 217:
WATER AENV SIRS 15 - 43 Section 12.
- Page 218 and 219:
WATER AENV SIRS 15 - 43 References
- Page 220 and 221:
WATER AENV SIRS 15 - 43 Reference p
- Page 222 and 223:
WATER AENV SIRS 15 - 43 Question No
- Page 224 and 225:
WATER AENV SIRS 15 - 43 Reference Q
- Page 226 and 227:
WATER AENV SIRS 15 - 43 Section 12.
- Page 228 and 229:
WATER AENV SIRS 15 - 43 Question No
- Page 230 and 231:
WATER AENV SIRS 15 - 43 Question No
- Page 232 and 233:
WATER AENV SIRS 15 - 43 Question No
- Page 234 and 235:
PIERRE RIVER MINE SUPPLEMENTAL INFO
- Page 236 and 237:
TERRESTRIAL AENV SIRS 44 - 78 Refer
- Page 238 and 239:
TERRESTRIAL AENV SIRS 44 - 78 Secti
- Page 240 and 241:
TERRESTRIAL AENV SIRS 44 - 78 Secti
- Page 242 and 243:
TERRESTRIAL AENV SIRS 44 - 78 Revis
- Page 244 and 245:
TERRESTRIAL AENV SIRS 44 - 78 Secti
- Page 246 and 247:
TERRESTRIAL AENV SIRS 44 - 78 Refer
- Page 248 and 249:
TERRESTRIAL AENV SIRS 44 - 78 Secti
- Page 250 and 251:
TERRESTRIAL AENV SIRS 44 - 78 Secti
- Page 252 and 253:
TERRESTRIAL AENV SIRS 44 - 78 Quest
- Page 254 and 255:
TERRESTRIAL AENV SIRS 44 - 78 Quest
- Page 256 and 257:
TERRESTRIAL AENV SIRS 44 - 78 Quest
- Page 258 and 259:
TERRESTRIAL AENV SIRS 44 - 78 Secti
- Page 260 and 261:
TERRESTRIAL AENV SIRS 44 - 78 Commo
- Page 262 and 263:
TERRESTRIAL AENV SIRS 44 - 78 Refer
- Page 264 and 265:
TERRESTRIAL AENV SIRS 44 - 78 Secti
- Page 266 and 267:
TERRESTRIAL AENV SIRS 44 - 78 Secti
- Page 268 and 269:
TERRESTRIAL AENV SIRS 44 - 78 Quest
- Page 270 and 271:
TERRESTRIAL AENV SIRS 44 - 78 Secti
- Page 272 and 273:
TERRESTRIAL AENV SIRS 44 - 78 Secti
- Page 274 and 275:
TERRESTRIAL AENV SIRS 44 - 78 Quest
- Page 276 and 277:
TERRESTRIAL AENV SIRS 44 - 78 Schne
- Page 278 and 279:
TERRESTRIAL AENV SIRS 44 - 78 Quest
- Page 280 and 281: TERRESTRIAL AENV SIRS 44 - 78 Refer
- Page 282 and 283: TERRESTRIAL AENV SIRS 44 - 78 Secti
- Page 284 and 285: TERRESTRIAL AENV SIRS 44 - 78 Secti
- Page 286 and 287: TERRESTRIAL AENV SIRS 44 - 78 Refer
- Page 288 and 289: TERRESTRIAL AENV SIRS 44 - 78 Refer
- Page 290 and 291: TERRESTRIAL AENV SIRS 44 - 78 Refer
- Page 292 and 293: TERRESTRIAL AENV SIRS 44 - 78 Refer
- Page 294 and 295: TERRESTRIAL AENV SIRS 44 - 78 Quest
- Page 296 and 297: TERRESTRIAL AENV SIRS 44 - 78 Figur
- Page 298 and 299: TERRESTRIAL AENV SIRS 44 - 78 Quest
- Page 300 and 301: TERRESTRIAL AENV SIRS 44 - 78 Secti
- Page 302 and 303: TERRESTRIAL AENV SIRS 44 - 78 Refer
- Page 304 and 305: TERRESTRIAL AENV SIRS 44 - 78 Refer
- Page 306 and 307: TERRESTRIAL AENV SIRS 44 - 78 Secti
- Page 308 and 309: TERRESTRIAL AENV SIRS 44 - 78 Refer
- Page 310 and 311: TERRESTRIAL AENV SIRS 44 - 78 Secti
- Page 312 and 313: PIERRE RIVER MINE SUPPLEMENTAL INFO
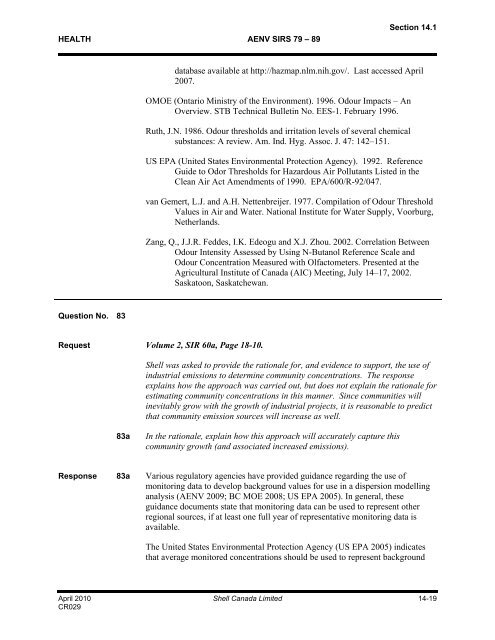
- Page 314 and 315: HEALTH AENV SIRS 79 - 89 Question N
- Page 316 and 317: HEALTH AENV SIRS 79 - 89 Methods Se
- Page 318 and 319: HEALTH AENV SIRS 79 - 89 Section 14
- Page 320 and 321: HEALTH AENV SIRS 79 - 89 Section 14
- Page 322 and 323: HEALTH AENV SIRS 79 - 89 minimum od
- Page 324 and 325: HEALTH AENV SIRS 79 - 89 Table AENV
- Page 326 and 327: HEALTH AENV SIRS 79 - 89 Table AENV
- Page 328 and 329: HEALTH AENV SIRS 79 - 89 Table AENV
- Page 332 and 333: HEALTH AENV SIRS 79 - 89 Section 14
- Page 334 and 335: HEALTH AENV SIRS 79 - 89 Section 14
- Page 336 and 337: HEALTH AENV SIRS 79 - 89 Section 14
- Page 338 and 339: HEALTH AENV SIRS 79 - 89 Section 14
- Page 340 and 341: HEALTH AENV SIRS 79 - 89 Section 14
- Page 342 and 343: HEALTH AENV SIRS 79 - 89 Section 14
- Page 344 and 345: HEALTH AENV SIRS 79 - 89 Section 14
- Page 346 and 347: HEALTH AENV SIRS 79 - 89 Question N
- Page 348 and 349: HEALTH AENV SIRS 79 - 89 Table AENV
- Page 350 and 351: PIERRE RIVER MINE SUPPLEMENTAL INFO
- Page 352 and 353: EPEA APPROVALS AENV SIRS 90 - 96 Qu
- Page 354 and 355: EPEA APPROVALS AENV SIRS 90 - 96 Se
- Page 356 and 357: PIERRE RIVER MINE SUPPLEMENTAL INFO
- Page 358 and 359: PIERRE RIVER MINE SUPPLEMENTAL INFO
- Page 360 and 361: GLOSSARY CEAA The abbreviation for
- Page 362 and 363: GLOSSARY ESR The abbreviation for e
- Page 364 and 365: GLOSSARY landform The configuration
- Page 366 and 367: GLOSSARY OSDG The abbreviation for
- Page 368 and 369: GLOSSARY SEWG The abbreviation for


