

Fourth Study Conference on BALTEX Scala Cinema Gudhjem
Fourth Study Conference on BALTEX Scala Cinema Gudhjem
Fourth Study Conference on BALTEX Scala Cinema Gudhjem

You also want an ePaper? Increase the reach of your titles
YUMPU automatically turns print PDFs into web optimized ePapers that Google loves.
- 130 -<br />
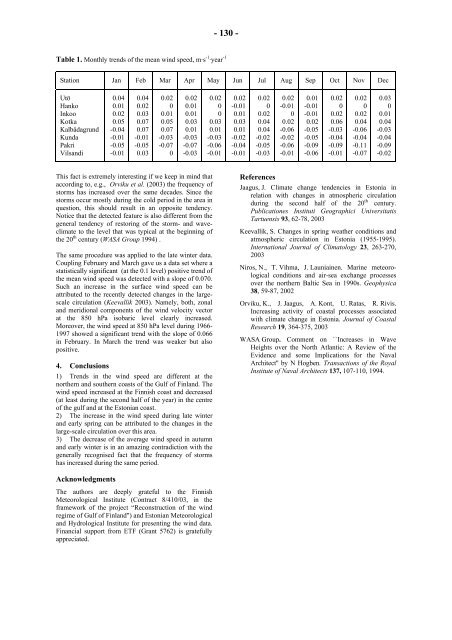
Table 1. M<strong>on</strong>thly trends of the mean wind speed, m·s -1 ·year -1<br />
Stati<strong>on</strong> Jan Feb Mar Apr May Jun Jul Aug Sep Oct Nov Dec<br />
Utö<br />
Hanko<br />
Inkoo<br />
Kotka<br />
Kalbådagrund<br />
Kunda<br />
Pakri<br />
Vilsandi<br />
0.04<br />
0.01<br />
0.02<br />
0.05<br />
-0.04<br />
-0.01<br />
-0.05<br />
-0.01<br />
0.04<br />
0.02<br />
0.03<br />
0.07<br />
0.07<br />
-0.01<br />
-0.05<br />
0.03<br />
0.02<br />
0<br />
0.01<br />
0.05<br />
0.07<br />
-0.03<br />
-0.07<br />
0<br />
0.02<br />
0.01<br />
0.01<br />
0.03<br />
0.01<br />
-0.03<br />
-0.07<br />
-0.03<br />
This fact is extremely interesting if we keep in mind that<br />
according to, e.g., Orviku et al. (2003) the frequency of<br />
storms has increased over the same decades. Since the<br />
storms occur mostly during the cold period in the area in<br />
questi<strong>on</strong>, this should result in an opposite tendency.<br />
Notice that the detected feature is also different from the<br />
general tendency of restoring of the storm- and waveclimate<br />
to the level that was typical at the beginning of<br />
the 20 th century (WASA Group 1994) .<br />
The same procedure was applied to the late winter data.<br />
Coupling February and March gave us a data set where a<br />
statistically significant (at the 0.1 level) positive trend of<br />
the mean wind speed was detected with a slope of 0.070.<br />
Such an increase in the surface wind speed can be<br />
attributed to the recently detected changes in the largescale<br />
circulati<strong>on</strong> (Keevallik 2003). Namely, both, z<strong>on</strong>al<br />
and meridi<strong>on</strong>al comp<strong>on</strong>ents of the wind velocity vector<br />
at the 850 hPa isobaric level clearly increased.<br />
Moreover, the wind speed at 850 hPa level during 1966-<br />
1997 showed a significant trend with the slope of 0.066<br />
in February. In March the trend was weaker but also<br />
positive.<br />
0.02<br />
0<br />
0<br />
0.03<br />
0.01<br />
-0.03<br />
-0.06<br />
-0.01<br />
4. C<strong>on</strong>clusi<strong>on</strong>s<br />
1) Trends in the wind speed are different at the<br />
northern and southern coasts of the Gulf of Finland. The<br />
wind speed increased at the Finnish coast and decreased<br />
(at least during the sec<strong>on</strong>d half of the year) in the centre<br />
of the gulf and at the Est<strong>on</strong>ian coast.<br />
2) The increase in the wind speed during late winter<br />
and early spring can be attributed to the changes in the<br />
large-scale circulati<strong>on</strong> over this area.<br />
3) The decrease of the average wind speed in autumn<br />
and early winter is in an amazing c<strong>on</strong>tradicti<strong>on</strong> with the<br />
generally recognised fact that the frequency of storms<br />
has increased during the same period.<br />
Acknowledgments<br />
The authors are deeply grateful to the Finnish<br />
Meteorological Institute (C<strong>on</strong>tract 8/410/03, in the<br />
framework of the project “Rec<strong>on</strong>structi<strong>on</strong> of the wind<br />
regime of Gulf of Finland") and Est<strong>on</strong>ian Meteorological<br />
and Hydrological Institute for presenting the wind data.<br />
Financial support from ETF (Grant 5762) is gratefully<br />
appreciated.<br />
0.02<br />
-0.01<br />
0.01<br />
0.03<br />
0.01<br />
-0.02<br />
-0.04<br />
-0.01<br />
0.02<br />
0<br />
0.02<br />
0.04<br />
0.04<br />
-0.02<br />
-0.05<br />
-0.03<br />
0.02<br />
-0.01<br />
0<br />
0.02<br />
-0.06<br />
-0.02<br />
-0.06<br />
-0.01<br />
0.01<br />
-0.01<br />
-0.01<br />
0.02<br />
-0.05<br />
-0.05<br />
-0.09<br />
-0.06<br />
0.02<br />
0<br />
0.02<br />
0.06<br />
-0.03<br />
-0.04<br />
-0.09<br />
-0.01<br />
0.02<br />
0<br />
0.02<br />
0.04<br />
-0.06<br />
-0.04<br />
-0.11<br />
-0.07<br />
0.03<br />
0<br />
0.01<br />
0.04<br />
-0.03<br />
-0.04<br />
-0.09<br />
-0.02<br />
References<br />
Jaagus, J. Climate change tendencies in Est<strong>on</strong>ia in<br />
relati<strong>on</strong> with changes in atmospheric circulati<strong>on</strong><br />
during the sec<strong>on</strong>d half of the 20 th century.<br />
Publicati<strong>on</strong>es Instituti Geographici Universitatis<br />
Tartuensis 93, 62-78, 2003<br />
Keevallik, S. Changes in spring weather c<strong>on</strong>diti<strong>on</strong>s and<br />
atmospheric circulati<strong>on</strong> in Est<strong>on</strong>ia (1955-1995).<br />
Internati<strong>on</strong>al Journal of Climatology 23, 263-270,<br />
2003<br />
Niros, N., T. Vihma, J. Launiainen. Marine meteorological<br />
c<strong>on</strong>diti<strong>on</strong>s and air-sea exchange processes<br />
over the northern Baltic Sea in 1990s. Geophysica<br />
38, 59-87, 2002<br />
Orviku, K., J. Jaagus, A. K<strong>on</strong>t, U. Ratas, R. Rivis.<br />
Increasing activity of coastal processes associated<br />
with climate change in Est<strong>on</strong>ia. Journal of Coastal<br />
Research 19, 364-375, 2003<br />
WASA Group. Comment <strong>on</strong> ``Increases in Wave<br />
Heights over the North Atlantic: A Review of the<br />
Evidence and some Implicati<strong>on</strong>s for the Naval<br />
Architect'' by N Hogben. Transacti<strong>on</strong>s of the Royal<br />
Institute of Naval Architects 137, 107-110, 1994.


