

Fourth Study Conference on BALTEX Scala Cinema Gudhjem
Fourth Study Conference on BALTEX Scala Cinema Gudhjem
Fourth Study Conference on BALTEX Scala Cinema Gudhjem

Create successful ePaper yourself
Turn your PDF publications into a flip-book with our unique Google optimized e-Paper software.
W(12 UTC) = 24.4 mm, W(00 UTC) = 25.5 mm, the<br />
difference, ∆ W = – 1.1 mm, or – 4.5% from the daily mean<br />
of W, is c<strong>on</strong>siderably less than standard deviati<strong>on</strong> of<br />
precipitable water in Tallinn (3.3 mm).<br />
W (mm)<br />
W (mm)<br />
W (mm)<br />
W (mm)<br />
45<br />
40<br />
35<br />
30<br />
25<br />
20<br />
15<br />
10<br />
5<br />
0<br />
45<br />
40<br />
35<br />
30<br />
25<br />
20<br />
15<br />
10<br />
5<br />
0<br />
45<br />
40<br />
35<br />
30<br />
25<br />
20<br />
15<br />
10<br />
5<br />
0<br />
45<br />
40<br />
35<br />
30<br />
25<br />
20<br />
15<br />
10<br />
5<br />
0<br />
Spring: R 2 = 0.93<br />
50 52 54 56 58 60 62 64 66 68<br />
Summer: R 2 = 0.67<br />
50 52 54 56 58 60 62 64 66 68<br />
Autumn: R 2 = 0.95<br />
50 52 54 56 58 60 62 64 66 68<br />
Winter: R 2 = 0.86<br />
50 52 54 56 58 60 62 64 66 68<br />
Latitude degree, φ<br />
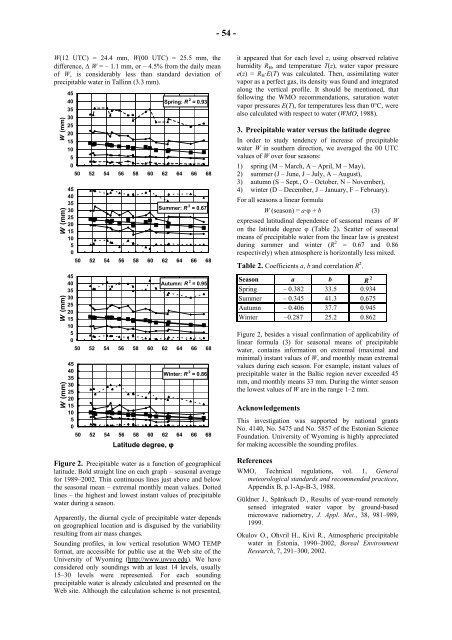
Figure 2. Precipitable water as a functi<strong>on</strong> of geographical<br />
latitude. Bold straight line <strong>on</strong> each graph – seas<strong>on</strong>al average<br />
for 1989–2002. Thin c<strong>on</strong>tinuous lines just above and below<br />
the seas<strong>on</strong>al mean – extremal m<strong>on</strong>thly mean values. Dotted<br />
lines – the highest and lowest instant values of precipitable<br />
water during a seas<strong>on</strong>.<br />
Apparently, the diurnal cycle of precipitable water depends<br />
<strong>on</strong> geographical locati<strong>on</strong> and is disguised by the variability<br />
resulting from air mass changes.<br />
Sounding profiles, in low vertical resoluti<strong>on</strong> WMO TEMP<br />
format, are accessible for public use at the Web site of the<br />
University of Wyoming (http://www.uwyo.edu). We have<br />
c<strong>on</strong>sidered <strong>on</strong>ly soundings with at least 14 levels, usually<br />
15–30 levels were represented. For each sounding<br />
precipitable water is already calculated and presented <strong>on</strong> the<br />
Web site. Although the calculati<strong>on</strong> scheme is not presented,<br />
- 54 -<br />
it appeared that for each level z, using observed relative<br />
humidity RH, and temperature T(z), water vapor pressure<br />
e(z) = R H·E(T) was calculated. Then, assimilating water<br />
vapor as a perfect gas, its density was found and integrated<br />
al<strong>on</strong>g the vertical profile. It should be menti<strong>on</strong>ed, that<br />
following the WMO recommendati<strong>on</strong>s, saturati<strong>on</strong> water<br />
vapor pressures E(T), for temperatures less than 0°C, were<br />
also calculated with respect to water (WMO, 1988).<br />
3. Precipitable water versus the latitude degree<br />
In order to study tendency of increase of precipitable<br />
water W in southern directi<strong>on</strong>, we averaged the 00 UTC<br />
values of W over four seas<strong>on</strong>s:<br />
1) spring (M – March, A – April, M – May),<br />
2) summer (J – June, J – July, A – August),<br />
3) autumn (S – Sept., O – October, N – November),<br />
4) winter (D – December, J – January, F – February).<br />
For all seas<strong>on</strong>s a linear formula<br />
W (seas<strong>on</strong>) = a·ϕ + b (3)<br />
expressed latitudinal dependence of seas<strong>on</strong>al means of W<br />
<strong>on</strong> the latitude degree ϕ (Table 2). Scatter of seas<strong>on</strong>al<br />
means of precipitable water from the linear law is greatest<br />
during summer and winter (R 2 = 0.67 and 0.86<br />
respectively) when atmosphere is horiz<strong>on</strong>tally less mixed.<br />
Table 2. Coefficients a, b and correlati<strong>on</strong> R 2 .<br />
Seas<strong>on</strong> a b R 2<br />
Spring – 0.382 33.5 0.934<br />
Summer – 0.345 41.3 0.675<br />
Autumn – 0.406 37.7 0.945<br />
Winter –0.287 25.2 0.862<br />
Figure 2, besides a visual c<strong>on</strong>firmati<strong>on</strong> of applicability of<br />
linear formula (3) for seas<strong>on</strong>al means of precipitable<br />
water, c<strong>on</strong>tains informati<strong>on</strong> <strong>on</strong> extremal (maximal and<br />
minimal) instant values of W, and m<strong>on</strong>thly mean extremal<br />
values during each seas<strong>on</strong>. For example, instant values of<br />
precipitable water in the Baltic regi<strong>on</strong> never exceeded 45<br />
mm, and m<strong>on</strong>thly means 33 mm. During the winter seas<strong>on</strong><br />
the lowest values of W are in the range 1–2 mm.<br />
Acknowledgements<br />
This investigati<strong>on</strong> was supported by nati<strong>on</strong>al grants<br />
No. 4140, No. 5475 and No. 5857 of the Est<strong>on</strong>ian Science<br />
Foundati<strong>on</strong>. University of Wyoming is highly appreciated<br />
for making accessible the sounding profiles.<br />
References<br />
WMO, Technical regulati<strong>on</strong>s, vol. 1, General<br />
meteorological standards and recommended practices,<br />
Appendix B, p.1-Ap-B-3, 1988.<br />
Güldner J., Spänkuch D., Results of year-round remotely<br />
sensed integrated water vapor by ground-based<br />
microwave radiometry, J. Appl. Met., 38, 981–989,<br />
1999.<br />
Okulov O., Ohvril H., Kivi R., Atmospheric precipitable<br />
water in Est<strong>on</strong>ia, 1990–2002, Boreal Envir<strong>on</strong>ment<br />
Research, 7, 291–300, 2002.


