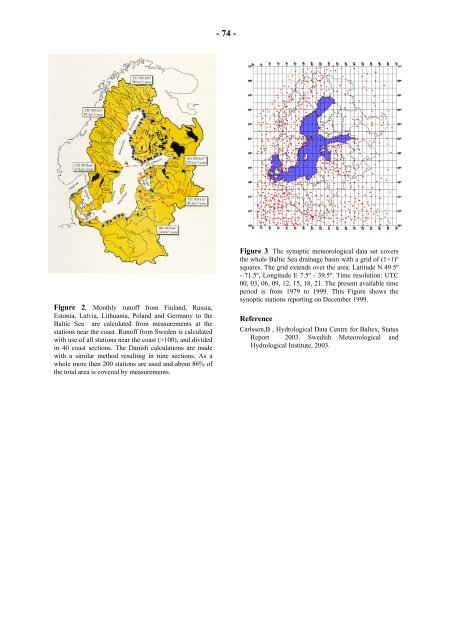
Figure 2. M<strong>on</strong>thly runoff from Finland, Russia, Est<strong>on</strong>ia, Latvia, Lithuania, Poland and Germany to the Baltic Sea are calculated from measurements at the stati<strong>on</strong>s near the coast. Runoff from Sweden is calculated with use of all stati<strong>on</strong>s near the coast (>100), and divided in 40 coast secti<strong>on</strong>s. The Danish calculati<strong>on</strong>s are made with a similar method resulting in nine secti<strong>on</strong>s. As a whole more then 200 stati<strong>on</strong>s are used and about 86% of the total area is covered by measurements. - 74 - Figure 3. The synoptic meteorological data set covers the whole Baltic Sea drainage basin with a grid of (1×1)º squares. The grid extends over the area: Latitude N 49.5º - 71.5º, L<strong>on</strong>gitude E 7.5º - 39.5º. Time resoluti<strong>on</strong>: UTC 00, 03, 06, 09, 12, 15, 18, 21. The present available time period is from 1979 to 1999. This Figure shows the synoptic stati<strong>on</strong>s reporting <strong>on</strong> December 1999. Reference Carlss<strong>on</strong>,B , Hydrological Data Centre for Baltex, Status Report 2003. Swedish Meteorological and Hydrological Institute, 2003.
- 75 - Hydrological and Hydrochemical Surface Water M<strong>on</strong>itoring Network in the Republic of Belarus Ryhor Chekan 1 and Vladimir Korneev 2 1 Republican Hydrometeorogical Centre , 110 Skaryna Avenue, 220023, Minsk, Republic of Belarus, tel. +375-172-64-03-20, fax +375-172-64-03-35, e-mail: chek@by.mecom.ru 2 Central Research Institute for Complex Use of Water Resources (CRICUWR), ½ Slavinskogo Str., 220086, Minsk, Republic of Belarus, tel. +375-172-63-48-33, fax +375-172-63-48-33, e-mail: cricuwr@inf<strong>on</strong>et.by, v_korneev@yahoo.com 1. Introducti<strong>on</strong> The rivers of the Republic of Belarus are related to two seas basins - Baltic and Black. These rivers are divided by a watershed of these seas. The river basins of Vistula (the Western Bug), Neman, Western Dvina and Neva (Lovat) bel<strong>on</strong>g to the Baltic Sea. Dnepr flows to the Black Sea. The distributi<strong>on</strong> of the territory of Belarus with respect to river basin is presented in table 1. Table 1. Name of river basin The area of territory of Byelorussia bel<strong>on</strong>ging to these river basins, km 2 Limits of change of the surface of flow, m (Baltic Sea Coordinate System Units) Western 33149 294,6 - Dvina 96,4 Lovat 483 233,1 - 144,6 Neman 45530 350,1 - 79,7 Western 9944 254,8 - Bug 119,0 Dnepr 67545 350,1 - (without Pripyat) 101,4 Pripyat 50899 334,0 - 102,8 Total 207600 350,1 - 79,7 Average height of a river basin above a level of the Baltic sea, m Density of a river network (in view of the rivers not less than 5 km), km/km 2 156 0,26 174 0,22 174 0,27 149 0,21 164 0,25 145 0,23 160 0,25 The Republic of Belarus is fairly well supplied with water resources. The available natural water resources are quite sufficient for meeting the current and future needs for water. In Belarus, 2% of available surface water and 7% of groundwater resources are used. Water resources of the Belarus range up to 57,9 km 3 in an average year, of which 34 km 3 are formed within the country. Rivers of the Black Sea basin and rivers of the Baltic Sea basin account for about 55% and 45% of annual water discharge, respectively. A major porti<strong>on</strong> of river flow (about 59%) is formed within the country. Water inflow from the territories of neighboring countries (Russia and the Ukraine) reaches 41%. Part of the river flow is accumulated in lakes and watercollecting areas of the republic (6,7 km 3 and 3,1 km 3 , respectively) [4]. Belarus has more than 10000 lakes with the total area of about 150000 ha, 130 000 reservoirs with the total area of 80000 ha and over 20000 rivers with the total length of 90600 km. Comm<strong>on</strong> average l<strong>on</strong>g-term drain of the rivers basins of Belarus is 57,9 km 3 (of which 34,0 km 3 are formed within Belarus). The department of Hydrometeorology is resp<strong>on</strong>sible for the organizati<strong>on</strong> for the hydrological, hydrochemical and hydrobiological m<strong>on</strong>itoring. This department is under the Ministry of Natural Resources and Envir<strong>on</strong>mental Protecti<strong>on</strong>. The observati<strong>on</strong> of surface waters is carried out by the m<strong>on</strong>itoring network of hydrological, hydrochemical and hydrobiological m<strong>on</strong>itoring. The important part of the m<strong>on</strong>itoring is the release of the cadastral documents c<strong>on</strong>taining analyzed and processed results of hydrological observati<strong>on</strong>s. The State Water Cadastre is published as Hydrological year-books incl. «Resources of surface waters », «Hydrological characteristics», «L<strong>on</strong>g-term hydrological characteristics», «Change of a hydrographic network», «Water resources, their use and quality». 2. Hydrological m<strong>on</strong>itoring network Observati<strong>on</strong>s over a hydrological regime <strong>on</strong> the territory of Belarus are started at the end of the 19 th century (1876 - 1881). From the beginning of observati<strong>on</strong>s until now a total of 705 stati<strong>on</strong>s have been operated. At present, there are 122 river m<strong>on</strong>itoring stati<strong>on</strong>s being operated by the Department of Hydrometeorology of the Ministry of Natural Resources and Envir<strong>on</strong>mental Protecti<strong>on</strong>. The distributi<strong>on</strong> of m<strong>on</strong>itoring stati<strong>on</strong>s is presented in table 2. Table 2 Amount of hydrological stati<strong>on</strong>s River basin Summary which functi<strong>on</strong> now Western Dvina 103 17 Neman (without Vilia) 89 12 Vilia 39 11 Western Bug 35 11 Dnepr (without Pripyat) 245 36 Summary 705 122 Permanent hydrological observati<strong>on</strong>s are carried out at 84 rivers and channels (122 posts), 14 lakes and water reservoirs (14 posts). 107 out of 122 m<strong>on</strong>itoring stati<strong>on</strong>s are water discharge stati<strong>on</strong>s, at 77 hydrological posts observati<strong>on</strong>s
- Page 1 and 2:
Fourth Stu
- Page 3:
Preface The 4 th Study</str
- Page 7 and 8:
- I - Table of Abstracts Title Auth
- Page 9 and 10:
- III - Sensitivity in Calculation
- Page 11 and 12:
- V - Parameter Estimation of the S
- Page 13 and 14:
- VII - The Realism of the ECHAM5.2
- Page 15 and 16:
Adam, W. K. .......................
- Page 17 and 18:
- 1 - Activities of the GEWEX Hydro
- Page 19 and 20:
eference site archive (Cabauw, Neth
- Page 21 and 22:
- 5 - Remote Sensing of Atmospheric
- Page 23 and 24:
minute averages around the satellit
- Page 25 and 26:
- 9 - Precipitation Type Statistics
- Page 27 and 28:
- 11 - Assimilation of New Land Sur
- Page 29 and 30:
Multichannel Microwave Radiometer f
- Page 31 and 32:
output has been processed in an equ
- Page 33 and 34:
height dependence of the Z-R-relati
- Page 35 and 36:
- 19 - CERES and Surface Radiation
- Page 37 and 38:
- 21 - Coastal Wind Mapping from Sa
- Page 39 and 40: - 23 - Clouds and Water Vapor over
- Page 41 and 42: - 25 - Broadband Cloud Albedo from
- Page 43 and 44: - 27 - Observation of Clouds and Wa
- Page 45 and 46: shows a ground-track of the vessel
- Page 47 and 48: - 31 - Determination and Comparison
- Page 49 and 50: - 33 - Spatial Variability of Snow
- Page 51 and 52: - 35 - EVA-GRIPS: Regional Evaporat
- Page 53 and 54: - 37 - LITFASS-2003 - A Land Surfac
- Page 55 and 56: -39- Calibrated Surface Temperature
- Page 57 and 58: - 41 - The Marine Boundary Layer -
- Page 59 and 60: - 43 - Characteristics of the Atmos
- Page 61 and 62: Figure 2. Surface stress from two d
- Page 63 and 64: During the experiment the water was
- Page 65 and 66: While the number of smallest drops
- Page 67 and 68: SCANDIA will not be supported any l
- Page 69 and 70: - 53 - Relationships Between Precip
- Page 71 and 72: - 55 - Analysis of the Role of Atmo
- Page 73 and 74: - 57 - Meteorological Peculiarities
- Page 75 and 76: Baltic Sea Inflow Events Jan Piechu
- Page 77 and 78: - 61 - The Different Baltic Inflows
- Page 79 and 80: - 63 - Observations of Turbulent Ki
- Page 81 and 82: - 65 - The Influence of Synoptic Si
- Page 83 and 84: -67- Improved Method for the Determ
- Page 85 and 86: -69- The Helicopter-Borne Turbulenc
- Page 87 and 88: - 71 - CEOP Reference Site Data fro
- Page 89: - 73 - The BALTEX Hydrological Data
- Page 93 and 94: -77- Sea-level Monitoring at MARNET
- Page 95 and 96: 1 0.8 0.6 0.4 0.2 GO(CLD-M) ERA40 S
- Page 97 and 98: Figure 2. Monhly mean values of lat
- Page 99 and 100: In the case of an ideal fit, the co
- Page 101 and 102: - 85 - Influence of Atmospheric For
- Page 103 and 104: The largest inter-annual variabilit
- Page 105 and 106: References Andrejev, O, Sokolov, A.
- Page 107 and 108: On the other hand, if the stratific
- Page 109 and 110: Cyberska 1989, Cyberska and Krzymin
- Page 111 and 112: - 95 - Continental-Scale Water-Bala
- Page 113 and 114: - 97 - ICTS (Inter-CSE Transferabil
- Page 115 and 116: The subsurface flow calculation is
- Page 117 and 118: functions only data with higher qua
- Page 119 and 120: - 103 - Modelling the Impact of Ine
- Page 121 and 122: - 105 - Objective Calibration of th
- Page 123 and 124: - 107 - Validation of Boundary Laye
- Page 125 and 126: - 109 - Simulated Dynamical Process
- Page 127 and 128: spreads along isobaths (fig.2). As
- Page 129 and 130: than the precipitation pattern of J
- Page 131 and 132: Figure 2. Long-term variability in
- Page 133 and 134: obvious from temperature charts. Ho
- Page 135 and 136: shortening of the winter seasons by
- Page 137 and 138: Maximum 5 day precipitation (mm) Nu
- Page 139 and 140: scale parameters the correlation be
- Page 141 and 142:
similar: the locations of main mini
- Page 143 and 144:
- 127 - Storminess on the Western C
- Page 145 and 146:
- 129 - Trends in Wind Speed over t
- Page 147 and 148:
- 131 - Wind Energy Prognoses for t
- Page 149 and 150:
- 133 - Detection of Climate Change
- Page 151 and 152:
Figure 3. Cross section of salinity
- Page 153 and 154:
of 35 m/s up to 3 hours. Data on wi
- Page 155 and 156:
Figure 2. Time series of Mean Sea L
- Page 157 and 158:
- 141 - Calculation and Forecast of
- Page 159 and 160:
- 143 - An Overview of Long-Term Ti
- Page 161 and 162:
- 145 - Baltic Sea Saltwater Inflow
- Page 163 and 164:
- 147 - Significance of Feedback in
- Page 165 and 166:
Lindström, G., Johansson, B., Pers
- Page 167 and 168:
- 151 - Air-Sea Fluxes Including Mo
- Page 169 and 170:
- 153 - The Realism of the ECHAM5.2
- Page 171 and 172:
- 155 - Figure 3. Accumulated total
- Page 173 and 174:
Figure 2. Example for Fourier decom
- Page 175 and 176:
Figure1. Modeled percent volume cha
- Page 177 and 178:
conditions even more challenging th
- Page 179 and 180:
surface heat fluxes close to zero.
- Page 181 and 182:
- 165 - Figure 1. Modeled seasonal
- Page 183 and 184:
- 167 - Present-Day and Future Prec
- Page 185 and 186:
- 169 - Extreme Precipitation on a
- Page 187 and 188:
at the stations Pärnu (Estonia) an
- Page 189 and 190:
6. Results There are many possible
- Page 191 and 192:
and vegetation, and to derive the h
- Page 193 and 194:
The structure of water bodies cadas
- Page 195 and 196:
Figure 1. The area of Gdańsk subje
- Page 197 and 198:
- 181 - Climate and Water Resources
- Page 199 and 200:
- 183 - Generating Synthetic Daily
- Page 201 and 202:
The evapotranspiration is affected
- Page 203 and 204:
Model parameters and coefficients:
- Page 205:
3. Hydrodynamic model of nutrient l
- Page 208 and 209:
No. 15: Minutes of 8 th Meeting of