El futuro de las pensiones en España: hacia un sistema mixto - CSIC
El futuro de las pensiones en España: hacia un sistema mixto - CSIC
El futuro de las pensiones en España: hacia un sistema mixto - CSIC

You also want an ePaper? Increase the reach of your titles
YUMPU automatically turns print PDFs into web optimized ePapers that Google loves.
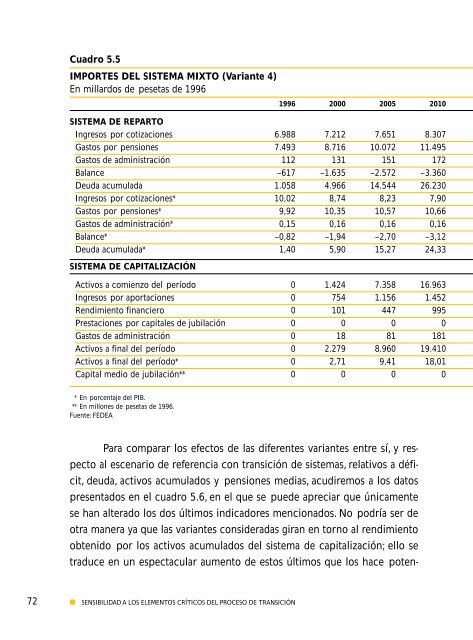
Cuadro 5.5<br />
IMPORTES DEL SISTEMA MIXTO (Variante 4)<br />
En millardos <strong>de</strong> pesetas <strong>de</strong> 1996<br />
Para comparar los efectos <strong>de</strong> <strong>las</strong> difer<strong>en</strong>tes variantes <strong>en</strong>tre sí, y respecto<br />
al esc<strong>en</strong>ario <strong>de</strong> refer<strong>en</strong>cia con transición <strong>de</strong> <strong>sistema</strong>s, relativos a déficit,<br />
<strong>de</strong>uda, activos acumulados y <strong>p<strong>en</strong>siones</strong> medias, acudiremos a los datos<br />
pres<strong>en</strong>tados <strong>en</strong> el cuadro 5.6, <strong>en</strong> el que se pue<strong>de</strong> apreciar que únicam<strong>en</strong>te<br />
se han alterado los dos últimos indicadores m<strong>en</strong>cionados. No podría ser <strong>de</strong><br />
otra manera ya que <strong>las</strong> variantes consi<strong>de</strong>radas giran <strong>en</strong> torno al r<strong>en</strong>dimi<strong>en</strong>to<br />
obt<strong>en</strong>ido por los activos acumulados <strong>de</strong>l <strong>sistema</strong> <strong>de</strong> capitalización; ello se<br />
traduce <strong>en</strong> <strong>un</strong> espectacular aum<strong>en</strong>to <strong>de</strong> estos últimos que los hace pot<strong>en</strong>-<br />
72 ■ SENSIBILIDAD A LOS ELEMENTOS CRÍTICOS DEL PROCESO DE TRANSICIÓN<br />
1996 2000 2005 2010<br />
SISTEMA DE REPARTO<br />
Ingresos por cotizaciones 6.988 7.212 7.651 8.307<br />
Gastos por <strong>p<strong>en</strong>siones</strong> 7.493 8.716 10.072 11.495<br />
Gastos <strong>de</strong> administración 112 131 151 172<br />
Balance –617 –1.635 –2.572 –3.360<br />
Deuda acumulada 1.058 4.966 14.544 26.230<br />
Ingresos por cotizaciones* 10,02 8,74 8,23 7,90<br />
Gastos por <strong>p<strong>en</strong>siones</strong>* 9,92 10,35 10,57 10,66<br />
Gastos <strong>de</strong> administración* 0,15 0,16 0,16 0,16<br />
Balance* –0,82 –1,94 –2,70 –3,12<br />
Deuda acumulada* 1,40 5,90 15,27 24,33<br />
SISTEMA DE CAPITALIZACIÓN<br />
Activos a comi<strong>en</strong>zo <strong>de</strong>l período 0 1.424 7.358 16.963<br />
Ingresos por aportaciones 0 754 1.156 1.452<br />
R<strong>en</strong>dimi<strong>en</strong>to financiero 0 101 447 995<br />
Prestaciones por capitales <strong>de</strong> jubilación 0 0 0 0<br />
Gastos <strong>de</strong> administración 0 18 81 181<br />
Activos a final <strong>de</strong>l período 0 2.279 8.960 19.410<br />
Activos a final <strong>de</strong>l período* 0 2,71 9,41 18,01<br />
Capital medio <strong>de</strong> jubilación** 0 0 0 0<br />
* En porc<strong>en</strong>taje <strong>de</strong>l PIB.<br />
** En millones <strong>de</strong> pesetas <strong>de</strong> 1996.<br />
Fu<strong>en</strong>te: FEDEA