- Page 1 and 2:
2004 INFORME ANUAL INTEGRADO DE LA
- Page 3 and 4:
ÍNDICE PRESENTACIÓN PARTE A. RELA
- Page 5 and 6:
d. Fondo de Cohesión .............
- Page 7 and 8:
PRESENTACIÓN En la Ley 3/1989 de A
- Page 9:
PARTE A Relaciones tributarias y si
- Page 12 and 13:
1.b. Marco jurídico El Concierto E
- Page 14 and 15:
En sus 20 años de vigencia, como c
- Page 16 and 17:
2.e. Adaptación, modificación y a
- Page 18 and 19:
En este ámbito, ha de subrayarse l
- Page 20 and 21:
Por otra parte, constituirán compe
- Page 22 and 23:
El punto de conexión es, por lo ta
- Page 24 and 25:
Tratándose de sujetos pasivos del
- Page 26 and 27:
La normativa autónoma de este Impu
- Page 28 and 29:
Los sujetos pasivos cuyo volumen de
- Page 30 and 31:
En otro orden de cosas, en las oper
- Page 32 and 33:
Cuando con arreglo a los criterios
- Page 34 and 35:
4.g. Impuesto sobre el Valor Añadi
- Page 36 and 37:
En el supuesto de que el sujeto pas
- Page 38 and 39:
c) Que la entidad realice en el Pa
- Page 40 and 41:
Así mismo, las Instituciones compe
- Page 42 and 43:
5. COORDINACIÓN Y COLABORACIÓN EN
- Page 44 and 45:
c) Acordar la metodología para el
- Page 46 and 47:
En otro escalón institucional se e
- Page 48 and 49:
7.a. Composición, funciones y orga
- Page 51 and 52:
Capítulo II Introducción al siste
- Page 53 and 54:
Durante la vigencia del Concierto E
- Page 55 and 56:
Ello supone un avance en el reconoc
- Page 57 and 58:
Los cambios producidos han sido ún
- Page 59 and 60:
4.b.2. Cupo líquido de los restant
- Page 61 and 62:
Así, la recaudación del IVA en la
- Page 63 and 64:
RF PV = RR PV +c’ RR TC - [(1-c
- Page 65 and 66:
Así, el modelo de distribución de
- Page 67 and 68:
Se modificó, también, el límite
- Page 69 and 70:
Esta metodología, con algunas pequ
- Page 71 and 72:
Para la aplicación de esta fórmul
- Page 73 and 74:
- la suma de los coeficientes verti
- Page 75 and 76:
8.f. Otras disposiciones Establecid
- Page 77 and 78:
Punto destacado de la reforma fue e
- Page 79 and 80:
Los criterios para pertenecer a cad
- Page 81 and 82:
Respecto a la distribución interna
- Page 83 and 84:
A estos recursos han de añadirse l
- Page 85 and 86:
El Programa incorpora también los
- Page 87 and 88:
Las inversiones del Plan se centran
- Page 89:
PARTE B Gestión de la Hacienda Vas
- Page 92 and 93:
2. ACTIVIDAD NORMATIVA 2.a. Activid
- Page 94 and 95:
COMUNIDAD AUTÓMA DEL PAÍS VASCO I
- Page 96 and 97:
. Modificaciones durante el ejercic
- Page 98 and 99:
Por otra parte, el Fondo de Inversi
- Page 100 and 101:
- En materia de carreteras, en 2000
- Page 102 and 103:
3.a.4. Fondos procedentes de la Uni
- Page 104 and 105:
La existencia del Fondo se justific
- Page 106 and 107:
Las emisiones en divisas realizadas
- Page 108 and 109:
2.200.000 EVOLUCIÓN DE LOS GASTOS
- Page 110 and 111:
PARTICIPACIÓN EN EL PIB pm DEL PA
- Page 112 and 113:
CUPO PROVISIONAL CUPOS LÍQUIDOS PR
- Page 114 and 115:
Desde la entrada en vigor del IVA e
- Page 116 and 117:
AJUSTES IMPUESTOS ESPECIALES DE FAB
- Page 119 and 120:
Capítulo IV Haciendas Forales de
- Page 121 and 122:
- Norma Foral 11/1991, de 17 de dic
- Page 123 and 124:
En ese mismo año, también entraro
- Page 125 and 126:
EVOLUCIÓN DEL NÚMERO DE DECLARACI
- Page 127 and 128:
EVOLUCIÓN DEL NÚMERO DE DECLARACI
- Page 129 and 130:
10.000.000 9.000.000 8.000.000 7.00
- Page 131 and 132:
En los Cuadros IV.7 al IV.10 y sus
- Page 133 and 134:
Respecto a las cuotas líquidas, so
- Page 135 and 136:
DISTRIBUCIÓN PORCENTUAL DE LAS BAS
- Page 137 and 138:
100 90 80 70 60 50 40 30 20 10 PROG
- Page 139 and 140:
EVOLUCIÓN DE LOS TIPOS MEDIOS Y EF
- Page 141 and 142:
143
- Page 143 and 144:
En el Cuadro IV.15 se presenta la e
- Page 145 and 146:
IRPF PAÍS VASCO 2003 RENDIMIENTOS
- Page 147 and 148:
PESO RELATIVO DE LAS DEDUCCIONES DE
- Page 149 and 150:
NIVELES DE RENTA BASE LIQUIDABLE (e
- Page 151 and 152:
DECLARACIÓN CONSOLIDADA IRPF DEL P
- Page 153 and 154:
En la reforma se incluyeron diferen
- Page 155 and 156:
El 73,2% de las sociedades declaran
- Page 157 and 158:
Un número elevado de sociedades de
- Page 159 and 160:
LIQUIDACIÓN CONSOLIDADA DEL IMPUES
- Page 161 and 162:
A pesar de tratarse de un tributo d
- Page 163 and 164:
Con este Impuesto se pretende conse
- Page 165 and 166:
El número total de declaraciones r
- Page 167 and 168:
Tras su implantación, la creación
- Page 169 and 170:
EVOLUCIÓN DECLARACIÓN CONSOLIDADA
- Page 171 and 172:
Además, en el Concierto se incorpo
- Page 173 and 174:
EVOLUCIÓN DE LA RECAUDACIÓN DEL I
- Page 175 and 176:
c. Impuesto sobre las Ventas Minori
- Page 177 and 178:
Se trata de un impuesto especial, p
- Page 179 and 180:
3.d. Gastos Fiscales Aún cuando el
- Page 181 and 182:
Para el conjunto de IRPF y la Comun
- Page 183 and 184:
3.e. La inspección de los tributos
- Page 185 and 186:
AÑOS EVOLUCIÓN DE LOS INGRESOS LI
- Page 187 and 188:
En 2004 se afianzó el tono expansi
- Page 189 and 190:
Contribuyeron a la mayor recaudaci
- Page 191 and 192:
RECAUDACIÓN LÍQUIDA POR TRIBUTOS
- Page 193 and 194:
ESTRUCTURA PORCENTUAL DE LA RECAUDA
- Page 195 and 196:
Respecto a las retenciones sobre la
- Page 197 and 198: También, los cambios normativos in
- Page 199 and 200: En 2003 y 2004, sin embargo, a un b
- Page 201 and 202: En consecuencia, se cierra el ejerc
- Page 203 and 204: - En cuanto al Impuesto sobre Trans
- Page 205 and 206: 3.500.000 3.250.000 3.000.000 2.750
- Page 207 and 208: En el período 1998-2001, sin cambi
- Page 209 and 210: En 1997 se liquidaron los ajustes c
- Page 211 and 212: Sobresalió el incremento de la rec
- Page 213 and 214: Al término de 1992 se entró en re
- Page 215 and 216: En 1997, con los nuevos tributos co
- Page 217 and 218: e. Evolución de las devoluciones E
- Page 219 and 220: EJECUCIÓN PRESUPUESTARIA DE TRIBUT
- Page 221 and 222: 2004 2003 2002 2001 2000 1999 EVOLU
- Page 223 and 224: En 1996 se incrementó ligeramente
- Page 225 and 226: 4.a.2. Transferencias recibidas Los
- Page 227 and 228: EVOLUCIÓN DE OTROS INGRESOS DE LAS
- Page 229 and 230: En cuanto a las resueltas, alcanzar
- Page 231: En cuanto al apartado de otras recl
- Page 234 and 235: Así mismo, la Ley 62/2003, como co
- Page 236 and 237: Además, el Consejo Vasco de Finanz
- Page 238 and 239: Al contrario de la Norma Foral 8/19
- Page 240 and 241: 2. El crédito presupuestario desti
- Page 242 and 243: EVOLUCIÓN PORCENTUAL DE LOS INGRES
- Page 244 and 245: RECAUDACIÓN DE TRIBUTOS LOCALES EN
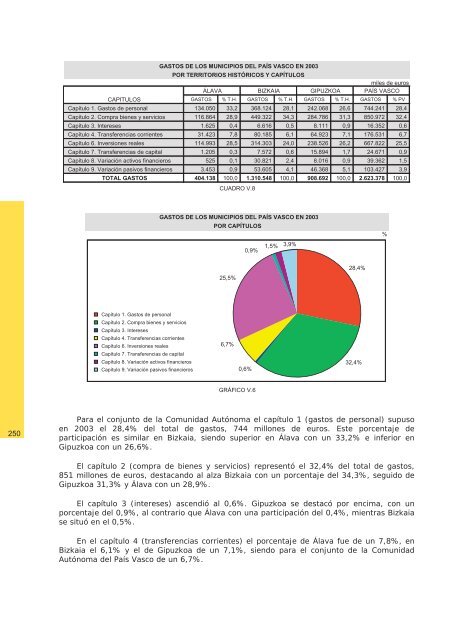
- Page 246 and 247: INGRESOS DE LOS MUNICIPIOS DEL PAÍ
- Page 250 and 251: PRESUPUESTO LIQUIDADO 2003 ENDEUDAM
- Page 252 and 253: 3.d. Consolidación global Como se
- Page 255: ANEXO I Actividad normativa de las
- Page 258 and 259: NORMA FORAL 29/2004, de 17 de dicie
- Page 260 and 261: DECRETO NORMATIVO DE URGENCIA FISCA
- Page 262 and 263: ganancias patrimoniales obtenidas c
- Page 264 and 265: (BOB nº 1, de 2 de enero de 2004)
- Page 266 and 267: No Residentes. (BOB nº 245, de 22
- Page 268 and 269: DECRETO FORAL 130/2004, de 20 de ju
- Page 270 and 271: ORDEN FORAL 1405/2003, de 23 de dic
- Page 272 and 273: IMPUESTO SOBRE EL VALOR AÑADIDO DE
- Page 274 and 275: abril de 2004) DECRETO FORAL 87/200
- Page 277: ANEXO II.1 Estadísticas relativas
- Page 280 and 281: 282 IRPF BIZKAIA 2003 BASES LIQUIDA
- Page 282 and 283: NIVELES DE RENTA BASE LIQUIDABLE (e
- Page 284 and 285: AÑOS EVOLUCIÓN IRPF ÁLAVA NÚMER
- Page 286 and 287: EVOLUCIÓN IRPF GIPUZKOA BASES LIQU
- Page 288 and 289: EVOLUCIÓN IRPF ÁLAVA CUOTAS ÍNTE
- Page 290 and 291: AÑOS EVOLUCIÓN IRPF ÁLAVA CUOTA
- Page 292 and 293: EVOLUCION IRPF GIPUZKOA CUOTAS LÍQ
- Page 294 and 295: 296 NIVELES DE RENTA BASE LIQUIDABL
- Page 296 and 297: 298
- Page 298 and 299:
300
- Page 300 and 301:
IRPF BIZKAIA 2003 302 NIVELES DE RE
- Page 302 and 303:
IRPF ÁLAVA 2003 RENDIMIENTOS MEDIO
- Page 304 and 305:
IRPF GIPUZKOA 2003 RENDIMIENTOS MED
- Page 306 and 307:
308 NIVELES DE RENTA BASE LIQUIDABL
- Page 308 and 309:
310 NIVELES DE RENTA BASE LIQUIDABL
- Page 310 and 311:
312 NIVELES DE RENTA BASE LIQUIDABL
- Page 312 and 313:
314 NIVELES DE RENTA BASE LIQUIDABL
- Page 315:
ANEXO II.2 Estadísticas relativas
- Page 318 and 319:
BASE LIQUIDABLE DEL IMPUESTO SOBRE
- Page 321 and 322:
DECLARACIÓN CONSOLIDADA IVA ÁLAVA
- Page 323:
DECLARACIÓN CONSOLIDADA IVA GIPUZK
- Page 327 and 328:
DETALLE ACTAS LIQUIDADAS DEUDA TRIB
- Page 329:
ANEXO III Detalles de la gestión e
- Page 333 and 334:
EVOLUCIÓN DE LA RECAUDACIÓN LÍQU
- Page 335 and 336:
EVOLUCIÓN DE LA RECAUDACIÓN LÍQU
- Page 337 and 338:
EVOLUCIÓN MENSUAL DE LA RECAUDACI
- Page 339 and 340:
EJECUCIÓN PRESUPUESTARIA DE TRIBUT
- Page 341:
EJECUCIÓN PRESUPUESTARIA DE TRIBUT
- Page 345 and 346:
AÑOS EVOLUCIÓN DE LOS INGRESOS LI
- Page 347 and 348:
EVOLUCIÓN DEL ENDEUDAMIENTO DIPUTA
- Page 349 and 350:
AÑOS EVOLUCIÓN DE LOS GASTOS POR
- Page 351:
ANEXO IV Detalles de la gestión ec
- Page 354 and 355:
356 RECAUDACIÓN POR TRIBUTOS LOCAL
- Page 356 and 357:
358 RECAUDACIÓN POR TRIBUTOS LOCAL
- Page 358 and 359:
PRESUPUESTOS LIQUIDADOS 1998-2003 I
- Page 360 and 361:
362 PRESUPUESTOS LIQUIDADOS 1998-20
- Page 362 and 363:
PRESUPUESTOS LIQUIDADOS 1998-2003 I
- Page 364 and 365:
366 PRESUPUESTO LIQUIDADO 2003 INGR
- Page 366 and 367:
368 PRESUPUESTO LIQUIDADO 2003 INGR
- Page 368 and 369:
370 PRESUPUESTOS LIQUIDADOS 1998-20
- Page 370 and 371:
372 PRESUPUESTOS LIQUIDADOS 1998-20
- Page 372 and 373:
PRESUPUESTOS LIQUIDADOS 1998-2003 I
- Page 374 and 375:
376 PRESUPUESTO LIQUIDADO 2003 GAST
- Page 376 and 377:
378 PRESUPUESTO LIQUIDADO 2003 GAST
- Page 378 and 379:
380 PRESUPUESTOS LIQUIDADOS 1998-20
- Page 380 and 381:
382 PRESUPUESTOS LIQUIDADOS 1998-20
- Page 382 and 383:
PRESUPUESTOS LIQUIDADOS 1998-2003 G
- Page 384 and 385:
386 PRESUPUESTO LIQUIDADO 2003 ENDE
- Page 386 and 387:
388 PRESUPUESTO LIQUIDADO 2003 ENDE