PDF 16,7 MBytes - Comune di Calco
PDF 16,7 MBytes - Comune di Calco
PDF 16,7 MBytes - Comune di Calco

You also want an ePaper? Increase the reach of your titles
YUMPU automatically turns print PDFs into web optimized ePapers that Google loves.
P.G.T. – Documento <strong>di</strong> Piano - RELAZIONE – <strong>Calco</strong> – Lecco<br />
B – ALLEGATI AL CAPITOLO 2 - TERRITORIO<br />
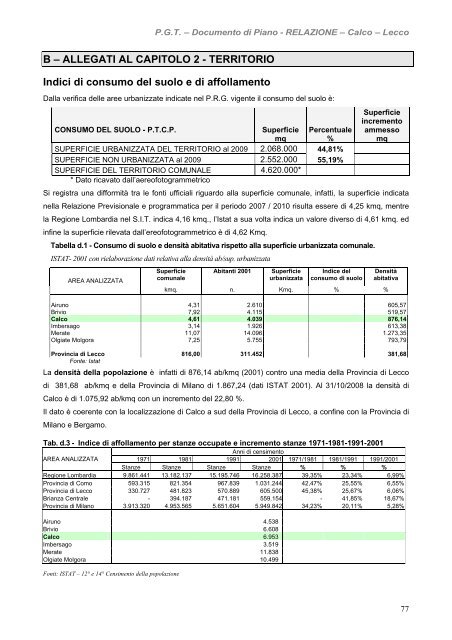
In<strong>di</strong>ci <strong>di</strong> consumo del suolo e <strong>di</strong> affollamento<br />
Dalla verifica delle aree urbanizzate in<strong>di</strong>cate nel P.R.G. vigente il consumo del suolo è:<br />
CONSUMO DEL SUOLO - P.T.C.P.<br />
Superficie Percentuale<br />
mq<br />
%<br />
SUPERFICIE URBANIZZATA DEL TERRITORIO al 2009 2.068.000 44,81%<br />
SUPERFICIE NON URBANIZZATA al 2009 2.552.000 55,19%<br />
SUPERFICIE DEL TERRITORIO COMUNALE<br />
* Dato ricavato dall’aereofotogrammetrico<br />
4.620.000*<br />
Superficie<br />
incremento<br />
ammesso<br />
mq<br />
Si registra una <strong>di</strong>fformità tra le fonti ufficiali riguardo alla superficie comunale, infatti, la superficie in<strong>di</strong>cata<br />
nella Relazione Previsionale e programmatica per il periodo 2007 / 2010 risulta essere <strong>di</strong> 4,25 kmq, mentre<br />
la Regione Lombar<strong>di</strong>a nel S.I.T. in<strong>di</strong>ca 4,<strong>16</strong> kmq., l’Istat a sua volta in<strong>di</strong>ca un valore <strong>di</strong>verso <strong>di</strong> 4,61 kmq. ed<br />
infine la superficie rilevata dall’ereofotogrammetrico è <strong>di</strong> 4,62 Kmq.<br />
Tabella d.1 - Consumo <strong>di</strong> suolo e densità abitativa rispetto alla superficie urbanizzata comunale.<br />
ISTAT- 2001 con rielaborazione dati relativa alla densità ab/sup. urbanizzata<br />
AREA ANALIZZATA<br />
Superficie<br />
comunale<br />
Abitanti 2001 Superficie<br />
urbanizzata<br />
In<strong>di</strong>ce del<br />
consumo <strong>di</strong> suolo<br />
Densità<br />
abitativa<br />
kmq. n. Kmq. % %<br />
Airuno 4,31 2.610 605,57<br />
Brivio 7,92 4.115 519,57<br />
<strong>Calco</strong> 4,61 4.039 876,14<br />
Imbersago 3,14 1.926 613,38<br />
Merate 11,07 14.096 1.273,35<br />
Olgiate Molgora 7,25 5.755 793,79<br />
Provincia <strong>di</strong> Lecco 8<strong>16</strong>,00 311.452 381,68<br />
Fonte: Istat<br />
La densità della popolazione è infatti <strong>di</strong> 876,14 ab/kmq (2001) contro una me<strong>di</strong>a della Provincia <strong>di</strong> Lecco<br />
<strong>di</strong> 381,68 ab/kmq e della Provincia <strong>di</strong> Milano <strong>di</strong> 1.867,24 (dati ISTAT 2001). Al 31/10/2008 la densità <strong>di</strong><br />
<strong>Calco</strong> è <strong>di</strong> 1.075,92 ab/kmq con un incremento del 22,80 %.<br />
Il dato è coerente con la localizzazione <strong>di</strong> <strong>Calco</strong> a sud della Provincia <strong>di</strong> Lecco, a confine con la Provincia <strong>di</strong><br />
Milano e Bergamo.<br />
Tab. d.3 - In<strong>di</strong>ce <strong>di</strong> affollamento per stanze occupate e incremento stanze 1971-1981-1991-2001<br />
Anni <strong>di</strong> censimento<br />
AREA ANALIZZATA<br />
1971 1981 1991 2001 1971/1981 1981/1991 1991/2001<br />
Stanze Stanze Stanze Stanze % % %<br />
Regione Lombar<strong>di</strong>a 9.861.441 13.182.137 15.195.746 <strong>16</strong>.258.387 39,35% 23,34% 6,99%<br />
Provincia <strong>di</strong> Como 593.315 821.354 967.839 1.031.244 42,47% 25,55% 6,55%<br />
Provincia <strong>di</strong> Lecco 330.727 481.823 570.889 605.500 45,38% 25,67% 6,06%<br />
Brianza Centrale - 394.187 471.181 559.154 - 41,85% 18,67%<br />
Provincia <strong>di</strong> Milano 3.913.320 4.953.565 5.651.604 5.949.842 34,23% 20,11% 5,28%<br />
Airuno 4.538<br />
Brivio 6.608<br />
<strong>Calco</strong> 6.953<br />
Imbersago 3.519<br />
Merate 11.838<br />
Olgiate Molgora 10.499<br />
Fonti: ISTAT – 12° e 14° Censimento della popolazione<br />
77