Plano Nacional de Políticas para as Mulheres (2004
Plano Nacional de Políticas para as Mulheres (2004
Plano Nacional de Políticas para as Mulheres (2004

Create successful ePaper yourself
Turn your PDF publications into a flip-book with our unique Google optimized e-Paper software.
<strong>Plano</strong> <strong>Nacional</strong> <strong>de</strong> <strong>Polític<strong>as</strong></strong> <strong>para</strong> <strong>as</strong> <strong>Mulheres</strong><br />
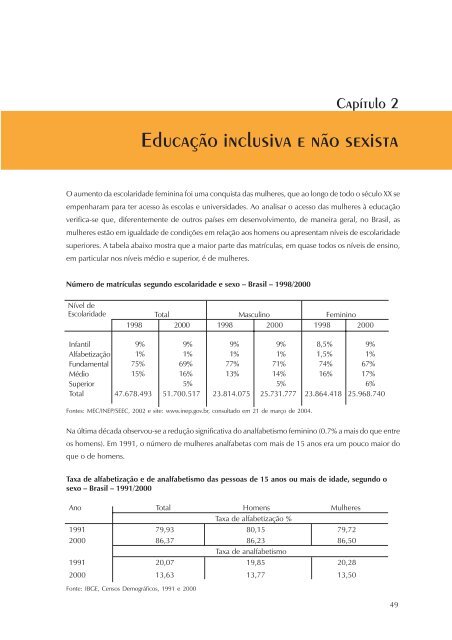
O aumento da escolarida<strong>de</strong> feminina foi uma conquista d<strong>as</strong> mulheres, que ao longo <strong>de</strong> todo o século XX se<br />
empenharam <strong>para</strong> ter acesso às escol<strong>as</strong> e universida<strong>de</strong>s. Ao analisar o acesso d<strong>as</strong> mulheres à educação<br />
verifica-se que, diferentemente <strong>de</strong> outros países em <strong>de</strong>senvolvimento, <strong>de</strong> maneira geral, no Br<strong>as</strong>il, <strong>as</strong><br />
mulheres estão em igualda<strong>de</strong> <strong>de</strong> condições em relação aos homens ou apresentam níveis <strong>de</strong> escolarida<strong>de</strong><br />
superiores. A tabela abaixo mostra que a maior parte d<strong>as</strong> matrícul<strong>as</strong>, em qu<strong>as</strong>e todos os níveis <strong>de</strong> ensino,<br />
em particular nos níveis médio e superior, é <strong>de</strong> mulheres.<br />
Número <strong>de</strong> matrícul<strong>as</strong> segundo escolarida<strong>de</strong> e sexo – Br<strong>as</strong>il – 1998/2000<br />
Nível <strong>de</strong><br />
Escolarida<strong>de</strong><br />
Total M<strong>as</strong>culino Feminino<br />
1998 2000 1998 2000 1998 2000<br />
Fontes: MEC/INEP/SEEC, 2002 e site: www.inep.gov.br, consultado em 21 <strong>de</strong> março <strong>de</strong> <strong>2004</strong>.<br />
Na última década observou-se a redução significativa do analfabetismo feminino (0.7% a mais do que entre<br />
os homens). Em 1991, o número <strong>de</strong> mulheres analfabet<strong>as</strong> com mais <strong>de</strong> 15 anos era um pouco maior do<br />
que o <strong>de</strong> homens.<br />
Taxa <strong>de</strong> alfabetização e <strong>de</strong> analfabetismo d<strong>as</strong> pesso<strong>as</strong> <strong>de</strong> 15 anos ou mais <strong>de</strong> ida<strong>de</strong>, segundo o<br />
sexo – Br<strong>as</strong>il – 1991/2000<br />
Ano Total Homens <strong>Mulheres</strong><br />
Taxa <strong>de</strong> alfabetização %<br />
1991 79,93 80,15 79,72<br />
2000 86,37 86,23 86,50<br />
Taxa <strong>de</strong> analfabetismo<br />
1991 20,07 19,85 20,28<br />
2000 13,63 13,77 13,50<br />
Fonte: IBGE, Censos Demográficos, 1991 e 2000<br />
Capítulo 2<br />
Educação inclusiva e não sexista<br />
Infantil<br />
9%<br />
9% 9% 9% 8,5% 9%<br />
Alfabetização 1%<br />
1% 1% 1% 1,5% 1%<br />
Fundamental 75% 69% 77% 71% 74% 67%<br />
Médio<br />
15% 16% 13% 14% 16% 17%<br />
Superior<br />
5%<br />
5%<br />
6%<br />
Total 47.678.493 51.700.517 23.814.075 25.731.777 23.864.418 25.968.740<br />
49