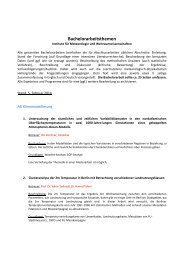
mfrow id. but the plots are drawn by row pch controls the type of symbol, either an <strong>in</strong>teger between 1 and 25, or any s<strong>in</strong>gle character with<strong>in</strong> "" 1 ● 2 3 4 5 6 7 8 9 10 ● 11 12 13 ● 14 15 16 ● 17 18 19 ● 20 ● 21 ● 22 23 24 25 * * . X X a a ? ? ps an <strong>in</strong>teger which controls the size <strong>in</strong> po<strong>in</strong>ts of texts and symbols pty a character which specifies the type of the plott<strong>in</strong>g region, "s": square, "m": maximal tck a value which specifies the length of tick-marks on the axes as a fraction of the smallest of the width or height of the plot; if tck=1 a grid is drawn tcl a value which specifies the length of tick-marks on the axes as a fraction of the height of a l<strong>in</strong>e of text (by default tcl=-0.5) xaxs, yaxs style of axis <strong>in</strong>terval calculation; default "r" for an extra space; "i" for no extra space xaxt if xaxt="n" the x-axis is set but not drawn (useful <strong>in</strong> conjunction with axis(side=1, ...)) yaxt if yaxt="n" the y-axis is set but not drawn (useful <strong>in</strong> conjonction with axis(side=2, ...)) Lattice (Trellis) graphics xyplot(y˜x) bivariate plots (with many functionalities) barchart(y˜x) histogram of the values of y with respect to those of x dotplot(y˜x) Cleveland dot plot (stacked plots l<strong>in</strong>e-by-l<strong>in</strong>e and column-bycolumn) densityplot(˜x) density functions plot histogram(˜x) histogram of the frequencies of x bwplot(y˜x) “box-and-whiskers” plot qqmath(˜x) quantiles of x with respect to the values expected <strong>und</strong>er a theoretical distribution stripplot(y˜x) s<strong>in</strong>gle dimension plot, x must be numeric, y may be a factor qq(y˜x) quantiles to compare two distributions, x must be numeric, y may be numeric, character, or factor but must have two ‘levels’ splom(˜x) matrix of bivariate plots parallel(˜x) parallel coord<strong>in</strong>ates plot levelplot(z˜x*y|g1*g2) coloured plot of the values of z at the coord<strong>in</strong>ates given by x and y (x, y and z are all of the same length) wireframe(z˜x*y|g1*g2) 3d surface plot cloud(z˜x*y|g1*g2) 3d scatter plot In the normal Lattice formula, y x|g1*g2 has comb<strong>in</strong>ations of optional condition<strong>in</strong>g variables g1 and g2 plotted on separate panels. Lattice functions take many of the same arguments as base graphics plus also data= the data frame for the formula variables and subset= for subsett<strong>in</strong>g. Use panel= to def<strong>in</strong>e a custom panel function (see apropos("panel") and ?ll<strong>in</strong>es). Lattice functions return an object of class trellis and have to be pr<strong>in</strong>t-ed to produce the graph. Use pr<strong>in</strong>t(xyplot(...)) <strong>in</strong>side functions where automatic pr<strong>in</strong>t<strong>in</strong>g doesn’t work. Use lattice.theme and lset to change Lattice defaults. Optimization and model fitt<strong>in</strong>g optim(par, fn, method = c("Nelder-Mead", "BFGS", "CG", "L-BFGS-B", "SANN") general-purpose optimization; par is <strong>in</strong>itial values, fn is function to optimize (normally m<strong>in</strong>imize) nlm(f,p) m<strong>in</strong>imize function f us<strong>in</strong>g a Newton-type algorithm with start<strong>in</strong>g values p lm(formula) fit l<strong>in</strong>ear models; formula is typically of the form response termA + termB + ...; use I(x*y) + I(xˆ2) for terms made of nonl<strong>in</strong>ear components glm(formula,family=) fit generalized l<strong>in</strong>ear models, specified by giv<strong>in</strong>g a symbolic description of the l<strong>in</strong>ear predictor and a description of the error distribution; family is a description of the error distribution and l<strong>in</strong>k function to be used <strong>in</strong> the model; see ?family nls(formula) nonl<strong>in</strong>ear least-squares estimates of the nonl<strong>in</strong>ear model parameters approx(x,y=) l<strong>in</strong>early <strong>in</strong>terpolate given data po<strong>in</strong>ts; x can be an xy plott<strong>in</strong>g structure spl<strong>in</strong>e(x,y=) cubic spl<strong>in</strong>e <strong>in</strong>terpolation loess(formula) fit a polynomial surface us<strong>in</strong>g local fitt<strong>in</strong>g Many of the formula-based model<strong>in</strong>g functions have several common arguments: data= the data frame for the formula variables, subset= a subset of variables used <strong>in</strong> the fit, na.action= action for miss<strong>in</strong>g values: "na.fail", "na.omit", or a function. The follow<strong>in</strong>g generics often apply to model fitt<strong>in</strong>g functions: predict(fit,...) predictions from fit based on <strong>in</strong>put data df.residual(fit) returns the number of residual degrees of freedom coef(fit) returns the estimated coefficients (sometimes with their standarderrors) residuals(fit) returns the residuals deviance(fit) returns the deviance fitted(fit) returns the fitted values 4 logLik(fit) computes the logarithm of the likelihood and the number of parameters AIC(fit) computes the Akaike <strong>in</strong>formation criterion or AIC Statistics aov(formula) analysis of variance model anova(fit,...) analysis of variance (or deviance) tables for one or more fitted model objects density(x) kernel density estimates of x b<strong>in</strong>om.test(), pairwise.t.test(), power.t.test(), prop.test(), t.test(), ... use help.search("test") Distributions rnorm(n, mean=0, sd=1) Gaussian (normal) rexp(n, rate=1) exponential rgamma(n, shape, scale=1) gamma rpois(n, lambda) Poisson rweibull(n, shape, scale=1) Weibull rcauchy(n, location=0, scale=1) Cauchy rbeta(n, shape1, shape2) beta rt(n, df) ‘Student’ (t) rf(n, df1, df2) Fisher–Snedecor (F) (χ 2 ) rchisq(n, df) Pearson rb<strong>in</strong>om(n, size, prob) b<strong>in</strong>omial rgeom(n, prob) geometric rhyper(nn, m, n, k) hypergeometric rlogis(n, location=0, scale=1) logistic rlnorm(n, meanlog=0, sdlog=1) lognormal rnb<strong>in</strong>om(n, size, prob) negative b<strong>in</strong>omial runif(n, m<strong>in</strong>=0, max=1) uniform rwilcox(nn, m, n), rsignrank(nn, n) Wilcoxon’s statistics All these functions can be used by replac<strong>in</strong>g the letter r with d, p or q to get, respectively, the probability density (dfunc(x, ...)), the cumulative probability density (pfunc(x, ...)), and the value of quantile (qfunc(p, ...), with 0 < p < 1). Programm<strong>in</strong>g function( arglist ) expr function def<strong>in</strong>ition return(value) if(cond) expr if(cond) cons.expr else alt.expr for(var <strong>in</strong> seq) expr while(cond) expr repeat expr break next Use braces {} aro<strong>und</strong> statements ifelse(test, yes, no) a value with the same shape as test filled with elements from either yes or no do.call(funname, args) executes a function call from the name of the function and a list of arguments to be passed to it readl<strong>in</strong>e(prompt = "") reads a l<strong>in</strong>e from the term<strong>in</strong>al, eg. user <strong>in</strong>put
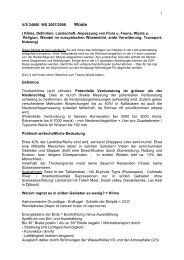
character expansion font = 1 (1,2,3,4,5 Symb.) font.axis font.lab font.ma<strong>in</strong> font.sub las=3 0 1 2 family="sans" family="HersheySans" cex = 1 cex.axis cex.lab cex.ma<strong>in</strong> cex.sub 2 1 0 bty = "o" o, L, 7, c, u, ] fg = "black" bg = "white" ann=TRUE adj = 0..1 l<strong>in</strong>ks..rechts bündig lab=c(5,5,7) c(x, y, len) 2 las=0 0,1,..3 las=2 1 0 las=1 0 las=0 0 1 2 ask=TRUE 2 2 1 1 0 0 1 2 Schriften Schriftfamilie: "serif", "sans", "mono", "symbol" od. Hershey Vektor-Schriften Vergrößerung Boxform/-typ um Grafik Farbe Vorder-/ H<strong>in</strong>tergr<strong>und</strong> Beschriftung an Achsen? Textausrichtung Label an Achse 0 1 2 vorm Neuzeichnen nachfragen? label assignment fig=c(0,1,0,1) c(xli,xre,yu,yo) xpd=TRUE Text <strong>und</strong> Text im Randbereich auch außerhalb Grafik zeichnen? col = "black" col.axis col.lab col.ma<strong>in</strong> col.sub tck=NA tcl=-0.5 text mtext polygon legend l<strong>in</strong>es abl<strong>in</strong>e panel.last= grid() zeichne z.B. grid() nachher? xlog=TRUE ylog=TRUE logarithisch an/aus Zeichenregion: woh<strong>in</strong> auf die Fläche? Farben asp = 0.5 panel.first= grid() zeichne z.B. grid() vorher? type="p" p, l, b, c, o, h, s, S, n Ticklänge bezüglich Grafik tcl-Tickausrichtung außen/<strong>in</strong>nen plotrix: color.legend po<strong>in</strong>ts y x Verhältnis f<strong>in</strong>=c(b,h) (figure) p<strong>in</strong>=c(b,h) Grafiktypen Text . . . srt=0 segments (plot) arrows ←−↗ Argumente von par(...) axes=TRUE Grafikfenster: aktuelle Breite/Höhe (Inch) L<strong>in</strong>iensegmente Achsen zeichnen? str<strong>in</strong>g rotation z.B. für text() plotrix: color.gradient mfrow=c(1,1) mfcol=c(1,1) rug c(nrow,ncol) axis par(...) plot(...) Argumente 0 1 2 3 4 5 6 7 Zusatzfunktionen 8 ann=TRUE grafische E<strong>in</strong>stellungen Punkttyp pch=1 9 10 11 12 13 14 15 grid Beschriftung an Achsen? 16 17181920212223 24 25"" Grafik Spalten/Reihen? lend=0 (0...3) 0-"ro<strong>und</strong>ed" 1-"butt" 2-"square" plotrix: axis.break rect y = Daten x = Daten y˜x log="x" "y" oder "xy" x/y logarithisch? plotrix: thigmophobe.labels box omi=c(0,0,0,0) c(u,li,o,re) (Inch) L<strong>in</strong>ienende ma<strong>in</strong>="Titel" xlim=c(2,20) ylim=c(2,20) Labels ohne Überlappung Grafik: outer marg<strong>in</strong> symbols title Wertebereich ljo<strong>in</strong>=0 (0...3) 0-"ro<strong>und</strong>" 1-"bevel" 2-"mitre" Symbole, Kreise contour image par(..) nur lesbar sub= "Untertitel" xlab="x-Achse" ylab="y-Achse" xaxt="s" yaxt="s" c.. = character mai=c(u,li,o,re) <strong>in</strong> Inch oma=c(0,0,0,0) c(u,li,o,re) (Textzeilen) L<strong>in</strong>ienverb<strong>in</strong>dung Achsen an/aus "s"/"n" marg<strong>in</strong> – <strong>in</strong>ch Ränder (Inch) Grafik: outer marg<strong>in</strong> mgp=c(3,1,0) lwd=1 (L<strong>in</strong>ienbreite) lty=0 (0...6) "dotted", ... manuell: "4951" mar= c(5,4,4,2)+0.1 xaxs="r" yaxs="r" xaxp=c(x1,x2,n) yaxp=c(y1,y2,n) c<strong>in</strong> c(b, h) csi h cra c(b, h) cxy c(b, h) d<strong>in</strong> c(b, h) mex=1 c(u,li,o,re) c(Titel, Label, Achse )*mex L<strong>in</strong>ientyp Achsenbereich: "r" - regulär (xlim ± 4%), "i" - <strong>in</strong>tern (wie xlim, ylim) Teilstriche wieviel? tickm<strong>in</strong>, tickmax, Anz.Intervalle Buchstabengröße (Inch) Buchstabenhöhe (Inch) normal Buchstabengröße (Raster) normal Buchstabengröße ("usr"- Koord<strong>in</strong>aten) normal Grafikschirm- Größe (Inch) Rand (Textzeilene<strong>in</strong>heitenn) Randskalierung Ränder <strong>in</strong> "mex"E<strong>in</strong>heiten
- Seite 1 und 2:
Skript zum Umgang und zur multivari
- Seite 3 und 4:
Inhaltsverzeichnis Abbildungsverzei
- Seite 5 und 6:
3.2.16 Balkendiagramme/Histogramme
- Seite 7 und 8:
4.6.1 Umkehrpunkte . . . . . . . .
- Seite 9 und 10:
1 Allgemeines Benutzung des Skripte
- Seite 11 und 12:
1 Allgemeines 1.2 Blitzstart die Au
- Seite 13 und 14:
1 Allgemeines 1.2 Blitzstart 1.2.2
- Seite 15 und 16:
1 Allgemeines 1.2 Blitzstart m[1,]
- Seite 17 und 18:
1 Allgemeines 1.2 Blitzstart par(ma
- Seite 19 und 20:
1 Allgemeines 1.4 Pakete laden, her
- Seite 21 und 22:
2 Daten log(...) # natürlicher Log
- Seite 23 und 24:
2 Daten 2.3 Datenumgang cat(file=ff
- Seite 25 und 26:
2 Daten 2.3 Datenumgang 2.3.4 Einge
- Seite 27 und 28:
2 Daten 2.3 Datenumgang # Reihe än
- Seite 29 und 30:
2 Daten 2.3 Datenumgang sich natür
- Seite 31 und 32:
2 Daten 2.3 Datenumgang # 1 (4.33,4
- Seite 33 und 34:
2 Daten 2.4 Transformieren . . . .
- Seite 35 und 36:
3 Grafik 3.1 Einstellungen Zusätze
- Seite 37 und 38:
3 Grafik 3.1 Einstellungen Zusätze
- Seite 39 und 40:
3 Grafik 3.1 Einstellungen Zusätze
- Seite 41 und 42:
3 Grafik 3.1 Einstellungen Zusätze
- Seite 43 und 44:
3 Grafik 3.1 Einstellungen Zusätze
- Seite 45 und 46:
3 Grafik 3.1 Einstellungen Zusätze
- Seite 47 und 48:
3 Grafik 3.1 Einstellungen Zusätze
- Seite 49 und 50:
3 Grafik 3.1 Einstellungen Zusätze
- Seite 51 und 52:
3 Grafik 3.1 Einstellungen Zusätze
- Seite 53 und 54:
3 Grafik 3.1 Einstellungen Zusätze
- Seite 55 und 56:
3 Grafik 3.1 Einstellungen Zusätze
- Seite 57 und 58:
3 Grafik 3.1 Einstellungen Zusätze
- Seite 59 und 60:
3 Grafik 3.2 Diagramme Für die Leg
- Seite 61 und 62:
3 Grafik 3.2 Diagramme # subset in
- Seite 63 und 64:
3 Grafik 3.2 Diagramme Entsprechend
- Seite 65 und 66:
3 Grafik 3.2 Diagramme def.par
- Seite 67 und 68:
3 Grafik 3.2 Diagramme Fallen mehre
- Seite 69 und 70:
3 Grafik 3.2 Diagramme # Zufallsdat
- Seite 71 und 72:
3 Grafik 3.2 Diagramme # Bsp.: Lini
- Seite 73 und 74:
3 Grafik 3.2 Diagramme −20 −25
- Seite 75 und 76:
3 Grafik 3.2 Diagramme # Gitternetz
- Seite 77 und 78:
3 Grafik 3.2 Diagramme par(las=1) #
- Seite 79 und 80:
3 Grafik 3.2 Diagramme par(las=1) #
- Seite 81 und 82:
3 Grafik 3.2 Diagramme −20 −25
- Seite 83 und 84:
3 Grafik 3.2 Diagramme plot.after =
- Seite 85 und 86:
3 Grafik 3.2 Diagramme 3.2.16 Balke
- Seite 87 und 88:
3 Grafik 3.2 Diagramme # mtext = ma
- Seite 89 und 90:
3 Grafik 3.2 Diagramme polygon(x.bo
- Seite 91 und 92:
3 Grafik 3.2 Diagramme # Sterndiagr
- Seite 93 und 94:
3 Grafik 3.2 Diagramme data(volcano
- Seite 95 und 96:
3 Grafik 3.2 Diagramme library(plot
- Seite 97 und 98:
4 Statistik set.seed(25) # Zufallsg
- Seite 99 und 100:
4 Statistik # allgemeine Modell Aus
- Seite 101 und 102:
4 Statistik 4.3 Regressionsanalyse
- Seite 103 und 104:
4 Statistik data(airquality) # Date
- Seite 105 und 106:
4 Statistik } val
- Seite 107 und 108:
4 Statistik rect.hclust(hc, h=50, w
- Seite 109 und 110:
4 Statistik library(fpc) # Paket la
- Seite 111 und 112:
4 Statistik msplot(boston.pv, edges
- Seite 113 und 114:
4 Statistik # Dendrogramm verkürze
- Seite 115 und 116:
4 Statistik 4.4.10 Heatmaps 4.4 Clu
- Seite 117 und 118:
4 Statistik 4.4 Clusteranalyse 3. D
- Seite 119 und 120:
4 Statistik similarities distances
- Seite 121 und 122:
4 Statistik Methode pro & contra Be
- Seite 123 und 124:
4 Statistik ostr.pca $ci s.arrow(o
- Seite 125 und 126:
4 Statistik 4.5 Ordinationsmethoden
- Seite 127 und 128:
4 Statistik # mit Maus platzieren l
- Seite 129 und 130:
4 Statistik ?dune # Hilfe zum Daten
- Seite 131 und 132:
4 Statistik # Schwerpunkt jeder Gru
- Seite 133 und 134:
4 Statistik # gehören die Daten zu
- Seite 135 und 136:
4 Statistik bnr2
- Seite 137 und 138:
4 Statistik YY
- Seite 139 und 140:
4 Statistik 4.8 Paläo - Rekonstruk
- Seite 141 und 142:
4 Statistik 4.8 Paläo - Rekonstruk
- Seite 143 und 144:
5 Programmierung # Grafik wieder 1x
- Seite 145 und 146:
5 Programmierung 5.1 Benutzerfunkti
- Seite 147 und 148:
6 Diverses NULL # default )# end sw
- Seite 149 und 150:
6 Diverses 6.5 L ATEX/HTML Ausgaben
- Seite 151 und 152:
7 Linkliste - Tutorien - Pakete We
- Seite 153 und 154:
7 Linkliste - Tutorien - Pakete Abb
- Seite 155 und 156:
7 Linkliste - Tutorien - Pakete Tab
- Seite 157 und 158:
7 Linkliste - Tutorien - Pakete än
- Seite 159 und 160:
Glossar A abhängig X → Y - Hier
- Seite 161 und 162:
B am Ähnlichsten ist, hat die Auto
- Seite 163 und 164:
Chi 2 - Test Mit dem Chi-Quadrat-Te
- Seite 165 und 166:
D Datentransformation Die Transform
- Seite 167 und 168:
E Eigenvektor Eigenvektoren eines l
- Seite 169 und 170:
Friedman - Test Der Friedman - Test
- Seite 171 und 172:
horseshoe effect Siehe arch effect.
- Seite 173 und 174:
und xi werden die Deskriptoren stan
- Seite 175 und 176: Manhattan-Metrik (auch City-Block-M
- Seite 177 und 178: Multikolinearität Das Vorliegen ei
- Seite 179 und 180: man schreibt das mathematisch so au
- Seite 181 und 182: P Datenmatrizen unsymmetrisch symme
- Seite 183 und 184: post-hoc Tests auch a posteriori Te
- Seite 185 und 186: R R - Modus s. Q - Modus. R 2 auch
- Seite 187 und 188: skaleninvariant Skaleninvarianz ist
- Seite 189 und 190: Normalverteilung: Shapiro-Wilk Test
- Seite 191 und 192: Verteilungen Binomialverteilung, B(
- Seite 193 und 194: W Ward Clusteranalyse Beim Ward - V
- Seite 195 und 196: Literatur Amaral, G. J. A., I. L. D
- Seite 197 und 198: Anhang Funktion 1: Zum Zeichnen von
- Seite 199 und 200: # NA - data (not available) show.na
- Seite 201 und 202: x.max
- Seite 203 und 204: x=seq(from=x.axis[1] , to=x.axis[nx
- Seite 205 und 206: data.null[, 1], col=ifelse(length(p
- Seite 207 und 208: } y1
- Seite 209 und 210: stop("\n#> 'chain' should be a char
- Seite 211 und 212: } ) data
- Seite 213 und 214: # y
- Seite 215 und 216: # stop("Stop: chain data needed wit
- Seite 217 und 218: "theta[ni=%8$2s]:%1$32.50f psi=%2$8
- Seite 219 und 220: # mod.lm
- Seite 221 und 222: xy$y[2:3]
- Seite 223 und 224: R Reference Card by Tom Short, EPRI
- Seite 225: Where leading zeros are shown they
- Seite 229 und 230: Index Alle Stichwörter mit (G) fin
- Seite 231 und 232: k - medoid pma(...) cluster . . . .
- Seite 233 und 234: Blattfunktion . . . . . . . . . . .
- Seite 235 und 236: Linienenden par(lend="rounded") 29
- Seite 237 und 238: Redundanzanalyse Glossar . . . . .
- Seite 239 und 240: Partial least squares . . . . . . .