Grafiken und Statistik in R
Grafiken und Statistik in R
Grafiken und Statistik in R

Erfolgreiche ePaper selbst erstellen
Machen Sie aus Ihren PDF Publikationen ein blätterbares Flipbook mit unserer einzigartigen Google optimierten e-Paper Software.
4 <strong>Statistik</strong><br />
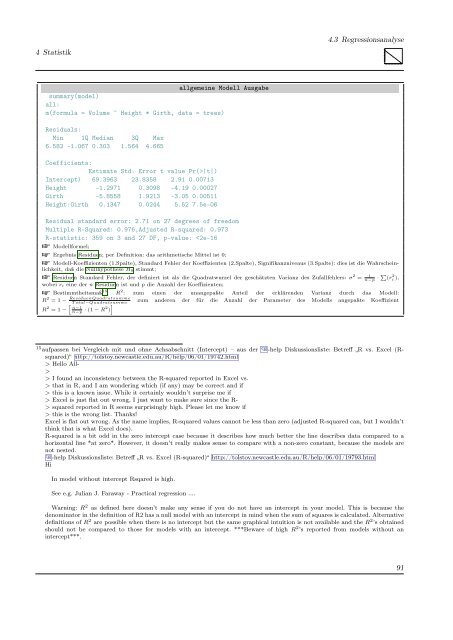
# allgeme<strong>in</strong>e Modell Ausgabe<br />
# summary(model)<br />
#all:<br />
#m(formula = Volume ~ Height * Girth, data = trees)<br />
#Residuals:<br />
# M<strong>in</strong> 1Q Median 3Q Max<br />
#6.582 -1.067 0.303 1.564 4.665<br />
#Coefficients:<br />
# Estimate Std. Error t value Pr(>|t|)<br />
#Intercept) 69.3963 23.8358 2.91 0.00713<br />
#Height -1.2971 0.3098 -4.19 0.00027<br />
#Girth -5.8558 1.9213 -3.05 0.00511<br />
#Height:Girth 0.1347 0.0244 5.52 7.5e-06<br />
#Residual standard error: 2.71 on 27 degrees of freedom<br />
#Multiple R-Squared: 0.976,Adjusted R-squared: 0.973<br />
#R-statistic: 359 on 3 and 27 DF, p-value: Hello All-<br />
><br />
> I fo<strong>und</strong> an <strong>in</strong>consistency between the R-squared reported <strong>in</strong> Excel vs.<br />
> that <strong>in</strong> R, and I am wonder<strong>in</strong>g which (if any) may be correct and if<br />
> this is a known issue. While it certa<strong>in</strong>ly wouldn’t surprise me if<br />
> Excel is just flat out wrong, I just want to make sure s<strong>in</strong>ce the R-<br />
> squared reported <strong>in</strong> R seems surpris<strong>in</strong>gly high. Please let me know if<br />
> this is the wrong list. Thanks!<br />
Excel is flat out wrong. As the name implies, R-squared values cannot be less than zero (adjusted R-squared can, but I wouldn’t<br />
th<strong>in</strong>k that is what Excel does).<br />
R-squared is a bit odd <strong>in</strong> the zero <strong>in</strong>tercept case because it describes how much better the l<strong>in</strong>e describes data compared to a<br />
horizontal l<strong>in</strong>e *at zero*. However, it doesn’t really makes sense to compare with a non-zero constant, because the models are<br />
not nested.<br />
-help Diskussionsliste: Betreff „R vs. Excel (R-squared)“ http://tolstoy.newcastle.edu.au/R/help/06/01/19793.html<br />
Hi<br />
In model without <strong>in</strong>tercept Rsqared is high.<br />
See e.g. Julian J. Faraway - Practical regression ....<br />
Warn<strong>in</strong>g: R 2 as def<strong>in</strong>ed here doesn’t make any sense if you do not have an <strong>in</strong>tercept <strong>in</strong> your model. This is because the<br />
denom<strong>in</strong>ator <strong>in</strong> the def<strong>in</strong>ition of R2 has a null model with an <strong>in</strong>tercept <strong>in</strong> m<strong>in</strong>d when the sum of squares is calculated. Alternative<br />
def<strong>in</strong>itions of R 2 are possible when there is no <strong>in</strong>tercept but the same graphical <strong>in</strong>tuition is not available and the R 2 ’s obta<strong>in</strong>ed<br />
should not be compared to those for models with an <strong>in</strong>tercept. ***Beware of high R 2 ’s reported from models without an<br />
<strong>in</strong>tercept***.<br />
y<br />
160 170 180 190 200<br />
●<br />
●<br />
●<br />
●<br />
● ●<br />
●<br />
●<br />
●<br />
●<br />
●<br />
●<br />
●<br />
●<br />
●<br />
20 30 40 50 60 70<br />
x<br />
91