View or print this publication - Northern Research Station - USDA ...
View or print this publication - Northern Research Station - USDA ...
View or print this publication - Northern Research Station - USDA ...
You also want an ePaper? Increase the reach of your titles
YUMPU automatically turns print PDFs into web optimized ePapers that Google loves.
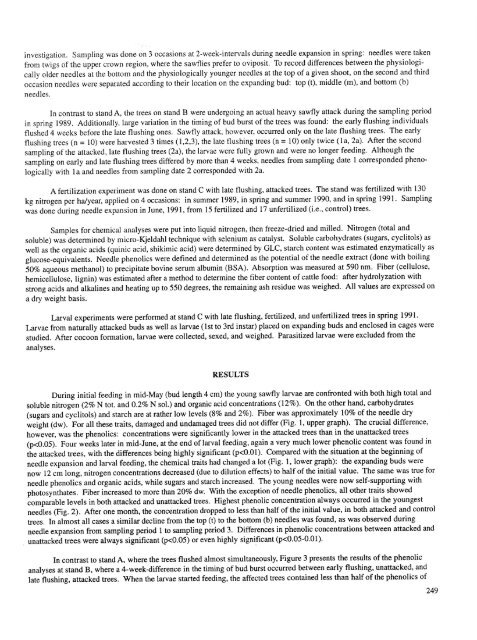
investigation. Sampling was done on 3 occasions at 2-week-intervals during needle expansion in spring: needles were taken<br />
from twigs of the upper crown region, where the sawflies prefer to oviposit. To rec<strong>or</strong>d differences between the physiologically<br />
older needles at the bottom and the physiologically younger needles at the top of a given shoot, on the second and third<br />
occasion needles were separated acc<strong>or</strong>ding to their location on the expanding bud: top (t), middle (m), and bottom (b)<br />
needles.<br />
In contrast to stand A, the trees on stand B were undergoing an actual heavy sawfly attack during the sampling period<br />
in spring 1989. Additionally, large variation in the timing of bud burst of the trees was found: the early flushing individuals<br />
flushed 4 weeks bef<strong>or</strong>e the late flushing ones. Sawfly attack, however, occurred only on the late flushing trees. The early<br />
flushing trees (n = 10) were harvested 3 times (1,2,3), the late flushing trees (n = 10) only twice (la, 2a). After the second<br />
sampling of the attacked, late flushing trees (2a), the larvae were fully grown and were no longer feeding. Although the<br />
sampling on early and late flushing trees differed by m<strong>or</strong>e than 4 weeks, needles from sampling date 1 c<strong>or</strong>responded phenologically<br />
with 1a and needles from sampling date 2 c<strong>or</strong>responded with 2a.<br />
A fertilization experiment was done on stand C with late flushing, attacked trees. The stand was fertilized with 130<br />
kg nitrogen per ha/year, applied on 4 occasions: in summer 1989, in spring and summer 1990, and in spring 1991. Sampling<br />
was done during needle expansion in June, 1991, from 15 fertilized and 17 unfertilized (i.e., control) trees.<br />
Samples f<strong>or</strong> chemical analyses were put into liquid nitrogen, then freeze-dried and milled. Nitrogen (total and<br />
soluble) was determined by micro-Kjeldahl technique with selenium as catalyst. Soluble carbohydrates (sugars, cyclitols) as<br />
well as the <strong>or</strong>ganic acids (quinic acid, shikimic acid) were determined by GLC, starch content was estimated enzymatically as<br />
glucose-equivalents. Needle phenolics were defined and determined as the potential of the needle extract (done with boiling<br />
50% aqueous methanol) to precipitate bovine serum albumin (BSA). Abs<strong>or</strong>ption was measured at 590 nm. Fiber (cellulose,<br />
hemicellulose, lignin) was estimated after a method to determine the fiber content of cattle food: after hydrolyzation with<br />
strong acids and alkalines and heating up to 550 degrees, the remaining ash residue was weighed. All values are expressed on<br />
a dry weight basis.<br />
Larval experiments were perf<strong>or</strong>med at stand C with late flushing, fertilized, and unfertilized trees in spring 1991.<br />
Larvae from naturally attacked buds as well as larvae (lst to 3rd instar) placed on expanding buds and enclosed in cages were<br />
studied. After cocoon f<strong>or</strong>mation, larvae were collected, sexed, and weighed. Parasitized larvae were excluded from the<br />
analyses.<br />
RESULTS<br />
During initial feeding in mid-May (bud length 4 cm) the young sawfly larvae are confronted with both high total and<br />
soluble nitrogen (2% N tot. and 0.2% N sol.) and <strong>or</strong>ganic acid concentrations (12%). On the other hand, carbohydrates<br />
(sugars and cyclitols) and starch are at rather low levels (8% and 2%). Fiber was approximately 10% of the needle dry<br />
weight (dw). F<strong>or</strong> all these traits, damaged and undamaged trees did not differ (Fig. 1, upper graph). The crucial difference,<br />
however, was the phenolics: concentrations were significantly lower in the attacked trees than in the unattacked trees<br />
(p


