- Page 1 and 2:
"
- Page 3 and 4:
DYNAMICS OF FOREST HERBIVORY: QUEST
- Page 5 and 6:
TABLE OF CONTENTS Seeking The Rules
- Page 7 and 8:
32. Companion planting of the nitro
- Page 9 and 10: GRIMALSKY, ¥.I., Research Institut
- Page 11 and 12: POUTTU, ANTTI, Finnish Forest Resea
- Page 13 and 14: persist in mature leaves and affect
- Page 15 and 16: THE SINK-SOURCE HYPOTHESIS: TYPE AN
- Page 17 and 18: late season defoliation decreases t
- Page 19 and 20: BLANCHE, C.A., LORIO, EL., Jr., SOM
- Page 21 and 22: NIEMELA, R, TUOMI, J,, and LOJANDER
- Page 24: induced reactions have been studied
- Page 28 and 29: summer, but the other sawfly specie
- Page 30 and 31: LARSSON, S., BJ(_RKMAN, C., and GRE
- Page 32 and 33: STAND AND LANDSCAPE DIVERSITY AS A
- Page 34 and 35: not related to resistance to the se
- Page 36 and 37: In contrast to the situation in eas
- Page 38 and 39: ROOT, R.B. 1973. Organization of a
- Page 40 and 41: We tlhus neglect two potential sour
- Page 42 and 43: c__ c__ 1T1 Ill a) a) 0 0 0 e 1 o e
- Page 44 and 45: c_ >l.s S S S m N < DN DN < D c DN
- Page 46 and 47: :hen k > 0 suggest that the cue or
- Page 48 and 49: oth as protective weapons and as po
- Page 50 and 51: DEFENSE THEORIES AND BIRCH RESISTAN
- Page 52 and 53: P 45 A L 40 A T 35 A B 30 I L 25 I
- Page 54 and 55: However, hares showed strong prefer
- Page 56 and 57: DUGLE, J.A. 1966. A taxonomic study
- Page 58 and 59: accommodate findings related to mic
- Page 62 and 63: Sulfhydryl-Disulfide Mechanisms In
- Page 64 and 65: Iraa prior experimental analysis of
- Page 66 and 67: FRAZIER, J.L. and HEITZ, J.R. 1975.
- Page 68 and 69: REICHARD, R 1993. From RNA to DNA,
- Page 70 and 71: ; trees, and between and within ind
- Page 72 and 73: Encapsulated objects are data struc
- Page 74 and 75: _re3.--The Lignum model can be cont
- Page 76 and 77: SEVERE DEFOLIATION Tree Fine Root +
- Page 78 and 79: RUMBAUGH, J., BLAHA, M., PREMERLANI
- Page 80 and 81: oo0 a b ol ¢' _achiman_i ()® 1,eA
- Page 82 and 83: 1000 Conspicuous Defo i at ion 100
- Page 84 and 85: 2.oo 2.oo o t 4 t ¢._ e'- 1.80 1.8
- Page 86 and 87: Qualitative Changes in [,eaves and
- Page 88 and 89: t00 2 Yr 1 Yr o_ 80 Treatment Treat
- Page 90 and 91: Table 2.--Body size of Q. purzctate
- Page 92 and 93: 06 b AddedBSA < 04 _ 2rag -'=' i:3
- Page 94 and 95: Severe Defol iat ion Site-A 1993 _
- Page 96 and 97: KAMATA, N. and IGARASHI, M. 1995b.
- Page 98 and 99: enclosure %r 20 post-diapausing sec
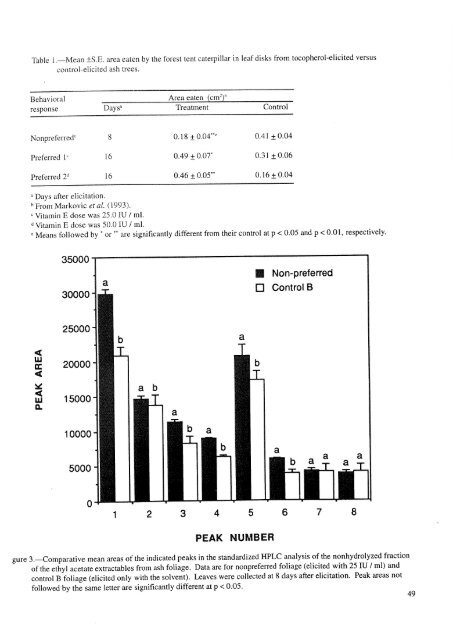
- Page 100 and 101: 2,500 F 000 F NF NF b _7 a _;_ a _7
- Page 102 and 103: 8O D 09 i 4,'.) F AS4L a Z___7 2o !
- Page 104 and 105: 2,500 _ st2-st4 El st5 0 st6 [_ pup
- Page 106 and 107: 96 SLANSKY, E, Jr. 1990. Insect nut
- Page 108 and 109: later, we selected one more floweri
- Page 110 and 111:
Table 2.---Mean spruce budworm perf
- Page 112 and 113:
Table 3..--Mean spruce budworm perf
- Page 114 and 115:
FOLIVORE FEEDING ON MALE CONIFER FL
- Page 116 and 117:
Table 3.--Lymantria monacha prefere
- Page 118 and 119:
500- 400- i 300 v ¢ m a 200- I00 L
- Page 120 and 121:
From the point of view of trees, th
- Page 122 and 123:
THE BLACKMARGINED APHID AS A KEYSTO
- Page 124 and 125:
Wood et al. (1987) report that M. c
- Page 126 and 127:
MIZELL, R.E 1991. Pesticides and be
- Page 128 and 129:
METHODS Study Site The study took p
- Page 130 and 131:
the samples. Fertilization had subs
- Page 132 and 133:
Table 2.--Percent nutrient content
- Page 134 and 135:
Some tree responses to fertilizatio
- Page 136 and 137:
PHYTOCHEMICAL PROTECTION AND NATURA
- Page 138 and 139:
Indirect effects of abiotic factors
- Page 140 and 141:
HUNTER, M.D. and PRICE, P.W. 1992.
- Page 142 and 143:
A° ADDITIVE C. HYBRID SUSCEPTIBILI
- Page 144 and 145:
Galls, leaf miners, or leaf folds w
- Page 146 and 147:
Table 2.--Summary of the hypotheses
- Page 148 and 149:
the inheritance patterns of seconda
- Page 150 and 151:
FLOATE, K.D. and WHITHAM, T.G. 1993
- Page 152 and 153:
Elements of the Suitability/Defense
- Page 154 and 155:
Table l.--Comparing the mean number
- Page 156 and 157:
ACKNOWLEDGEMENTS The authors sincer
- Page 158 and 159:
SINGH, D.R 1986_ Breeding for resis
- Page 160 and 161:
The objectives of this presentation
- Page 162 and 163:
Table 1.--Average weevil attack on
- Page 164 and 165:
1977, Kline and Mitchell 1979, Wood
- Page 166 and 167:
Further research is underway to cla
- Page 168 and 169:
A SUGI CLONE HIGHLY PALATABLE TO HA
- Page 170 and 171:
RESULTS Seasonal Stability of Palat
- Page 172 and 173:
-
- Page 174 and 175:
OGAWA, A., NAGATA, Y., and SUKENO,
- Page 176 and 177:
MATERIALS AND METHODS Field Work In
- Page 178 and 179:
Laboratory Procedures The week afte
- Page 180 and 181:
E 120 Nogent-sur-Vernisson Remnings
- Page 182 and 183:
Interdependence Between Reaction Zo
- Page 184 and 185:
alance hypothesis (Lorio 1986) cann
- Page 186 and 187:
SOLHEIM, H., LANGSTROM, B., and HEL
- Page 188 and 189:
In a second experiment, three 30-ye
- Page 190 and 191:
Considering biochemical pathways, i
- Page 192 and 193:
- = 120 N /'_" =40 1/ _ j Days 0 _
- Page 194 and 195:
BIGGS, A.R. 1985. Suberized boundar
- Page 196 and 197:
DIFFERENTIAL SUSCEPTIBILITY OF WHIT
- Page 198 and 199:
Table 2.--Mortality of white fir pr
- Page 200 and 201:
Results from the geographic range p
- Page 202 and 203:
esulting seedlings were then rooted
- Page 204 and 205:
-0.2 0 5 82. _j -0,4 e a a a D4 E I
- Page 206 and 207:
1960, Kalkstein 1976). Increased su
- Page 208 and 209:
RYAN, B.F., JOtNER, B.L., and RYAN,
- Page 210 and 211:
It is seldom feasible to control wa
- Page 212 and 213:
15 15 u. 10 |O O N tal 5 5 g ao o 4
- Page 214 and 215:
Only recently have we conducted stu
- Page 216 and 217:
esistance to beetle attack. Another
- Page 218 and 219:
LORIO, EL., Jr'. and HODGES, J.D. 1
- Page 220 and 221:
EFFECTS OF ROOT INHABITING INSECT-F
- Page 222 and 223:
OCCURRENCE OF ROOT AND STEM SUBCORT
- Page 224 and 225:
]Predisposition of Root-infected Tr
- Page 226 and 227:
chemistry associated with root colo
- Page 228 and 229:
Implications to Natural Resource Ma
- Page 230 and 231:
KLEPZIG, K.D., RAFFA, K.F., and SMA
- Page 232 and 233:
RAFFA, K.F., PHILLIPS, T., and SALO
- Page 234 and 235:
METHODS The study was installed in
- Page 236 and 237:
FURNISS, M.M., LIVINGSTON, R.L., an
- Page 238 and 239:
METHODS In the spring and summer of
- Page 240 and 241:
The importance of a compound as a r
- Page 242 and 243:
WERNER, R.A. 1995. Toxicity and rep
- Page 244 and 245:
41 40 42 \ 4t 42 41 42 ",,,\ 42 40
- Page 246 and 247:
Table 1.--Summary data for the 26 p
- Page 248 and 249:
One weakness of using data from gen
- Page 250 and 251:
Lower Peninsula (populations 14-26)
- Page 252 and 253:
AUCLAIR, A.ND., WORREST, R.C., LACH
- Page 254 and 255:
KELLOMAKI, S., HANNINEN, H., and KO
- Page 256 and 257:
WARGO, RM. and HAACK, R.A. 1991. Un
- Page 258 and 259:
investigation. Sampling was done on
- Page 260 and 261:
Figure 2.--Changes in protein preci
- Page 262 and 263:
q) J 400 T J ! i i i i o control tr
- Page 264 and 265:
attacked trees than in control tree
- Page 266 and 267:
ACIDIC DEPOSITION, DROUGHT, AND INS
- Page 268 and 269:
Table 1.--Impact of acidic fog upon
- Page 270 and 271:
MENGEL, K., BREININGER, T., and LUT
- Page 272 and 273:
THE RESISTANCE OF SCOTCH PINE TO DE
- Page 274 and 275:
EXPERIMENTAL METHODS Experiments we
- Page 276 and 277:
C w Q. 1,200 1,000 o 800 C_ --- 600
- Page 278 and 279:
0 .................................
- Page 280 and 281:
FONTAtNE, R.G. 1985. Forty years of
- Page 282 and 283:
Host Defenses An important componen
- Page 284 and 285:
Functional Heterogeneity of Forest
- Page 286 and 287:
The Connectivity Index (CI). The CI
- Page 288 and 289:
FUNCTIONAL HETEROGENEITYANALYSIS :
- Page 290 and 291:
The Modified Hazard Map. The next l
- Page 292 and 293:
systems facilitate mapping of fores
- Page 294 and 295:
KOLASA, J. and ROLLO, C.D. 1991. In
- Page 296:
) i,i_i)i_)i_i_ U.S. Departme_]t of