Contents - Max-Planck-Institut für Physik komplexer Systeme
Contents - Max-Planck-Institut für Physik komplexer Systeme
Contents - Max-Planck-Institut für Physik komplexer Systeme

You also want an ePaper? Increase the reach of your titles
YUMPU automatically turns print PDFs into web optimized ePapers that Google loves.
macroscopic plasma current Je(t) is determined by the<br />
microscopic velocity distribution v(t,t0) of electrons<br />
born at the time t0 [2, 3],<br />
Je(t) = q<br />
t<br />
−∞<br />
v(t,t0) ρe(t0)dt0. ˙<br />
(2)<br />
Assuming zero velocity for new-born electrons and<br />
neglecting the influence of the magnetic field and<br />
electron-electron interaction, the electron velocity reads<br />
v(t,t0) = q t<br />
me t0 E(τ)exp[−νe(t − τ)]dτ, where νe is the<br />
electron-ion collision rate. With Eq. (2) we obtain<br />
Je(t) ˙ + νeJe(t) = q2<br />
E(t)ρe(t). (3)<br />
me<br />
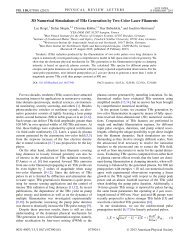
Let us now investigate the dependence of THz generation<br />
on the gas pressure. Measured spectra over<br />
the complete pressure range between 1 mbar and<br />
1000 mbar are shown as a contour plot in Fig. 2(a). Our<br />
HgCdTe detector is sensitive in a frequency range from<br />
20 THz to 170 THz. For a comparison of theory and<br />
experiment, this high-frequency part of the spectra is<br />
most relevant. Fig. 2(c) shows a low-frequency spectrum<br />
with the characteristic maximum below 5 THz, in<br />
agreement with the simulated spectra.<br />
<br />
<br />
<br />
<br />
<br />
<br />
<br />
<br />
<br />
<br />
<br />
<br />
<br />
<br />
<br />
<br />
<br />
<br />
<br />
<br />
<br />
<br />
<br />
<br />
Figure 2: Measured THz spectra (a) and simulation results (b) for<br />
pressures between 1 and 1000 mbar. In (d), experimental (solid lines)<br />
and theoretical (dashed lines) spectra are compared for various pressures.<br />
In (e), the overall THz yield versus pressure is shown (simulation:<br />
dashed line, experiment: solid line). (c) Low frequency spectrum<br />
for 1000 mbar measured by electro-optic sampling in ZnTe, corrected<br />
for the frequency-dependent detector response. Shading signifies<br />
frequency ranges where no experimental data are available.<br />
[1] D. J. Cook and R. M. Hochstrasser Opt. Lett. 25, 1210 (2000).<br />
[2] K. Kim, J. Glownia, A. Taylor, and G. Rodriguez, Opt. Expr. 15, 4577 (2007); Nat. Phot. 2, 605 (2008).<br />
[3] M. D. Thomson, M. Kress, T. Loeffler, H. G. Roskos, Laser & Photon. Rev. 1, 349 (2007).<br />
[4] M. Kolesik and J. V. Moloney, Phys. Rev. E 70, 036604 (2004).<br />
[5] A. Dalgarno and A. E. Kingston, Proc. Royal Soc. London A 259, 424 (1960).<br />
<br />
<br />
<br />
<br />
The observed dependence of the spectral width on the<br />
pressure can not be explained by the local plasma current,<br />
in which the variation of pressure only results in<br />
an amplitude scaling of the current. Instead, it originates<br />
from pressure dependent nonlinear propagation<br />
effects. We observe small blue-shifts δν of the central<br />
frequencies caused by the nonlinear plasma-induced<br />
change of the refraction index. These shifts are 1 THz in<br />
the fundamental and ∼ 0.4 THz in the second harmonic<br />
at z = 0.2 mm for 400 mbar, and depend strongly on the<br />
gas pressure. Surprisingly, these very small frequency<br />
shifts have a dramatic influence on the generated THz<br />
spectrum. To explain the physical origin of this very<br />
sensitive dependence, let us first illustrate the mechanism<br />
behind THz generation. In Fig. 1(a) we present<br />
the electron density, which shows a stepwise increase<br />
near the tunnel ionization events at the field maxima.<br />
In a simplified model, we can assume rectangular steps<br />
in the electron density [ ˙ρe(t) = Σnρnδ(t − tn)] and<br />
νe = 0, and thereby obtain a discrete version of Eq. (2):<br />
Je(t) ∼ <br />
ρnH(t − tn)[vf(t) − vf(tn)], (4)<br />
n<br />
where H(t) is the Heaviside step function, vf(t) =<br />
q t<br />
E(τ)dτ is the free electron velocity such that<br />
me −∞<br />
v(t,tn) = [vf(t) − vf(tn)], and ρn is the electron density<br />
created in the nth ionization event. For a monochromatic<br />
electric field vf(tn) = 0. The Fourier transformation<br />
of the step function H(t) exhibits a lowfrequency<br />
spectrum ∝ 1/ω. Therefore THz radiation<br />
is generated by the second term in Eq. (4) proportional<br />
to vf(tn), while the first term contributes in the spectral<br />
range of the pump fields. For a two-color optical<br />
field, E = A1 cos[(ω0 + δω)t] + A2 cos(2ω0t + θ), the<br />
field maxima in every half-cycle are given by ω0tn ≈<br />
nπ − nπδω/ω0 − (−1) n2r sinθ, provided that A2/A1 =<br />
r ≪ 1 and nδω ≪ ω0. Hence, the points in time tn and<br />
therefore the free velocities vf(tn) alter significantly<br />
when δω (and θ) change upon the propagation. As seen<br />
above, the low-frequency spectrum is determined by a<br />
sum over contributions ∼ vf(tn), and this sum finally<br />
determines the THz spectral shape. In the full (3+1)dimensional<br />
geometry, the spectral shapes generated at<br />
different spatial points are added and averaged, leading<br />
to the observed strong spectral broadening, which<br />
is thus explained by propagation effects of the pump.<br />
[6] I. Babushkin, W. Kuehn, C. Köhler, S. Skupin, L. Bergé, K. Reimann, M. Woerner, J. Herrmann, and T. Elsaesser, PRL 105, 053903 (2010)<br />
2.19. Terahertz Generation by Ionizing Two-Color Femtosecond Pulses in Gases 79