2007 Reference document (PDF) - Valeo
2007 Reference document (PDF) - Valeo
2007 Reference document (PDF) - Valeo

You also want an ePaper? Increase the reach of your titles
YUMPU automatically turns print PDFs into web optimized ePapers that Google loves.
2 Management<br />
PAGE 64<br />
Report<br />
Environmental management and performance<br />
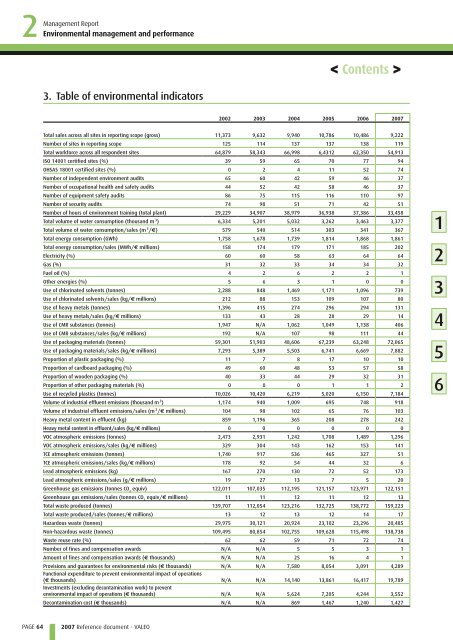
3. Table of environmental indicators<br />
<strong>2007</strong> <strong>Reference</strong> <strong>document</strong> - VALEO<br />
< Contents ><br />
2002 2003 2004 2005 2006 <strong>2007</strong><br />
Total sales across all sites in reporting scope (gross) 11,373 9,632 9,940 10,786 10,486 9,222<br />
Number of sites in reporting scope 125 114 137 137 138 119<br />
Total workforce across all respondent sites 64,879 58,343 66,998 6,4312 62,350 54,913<br />
ISO 14001 certified sites (%) 39 59 65 70 77 94<br />
OHSAS 18001 certified sites (%) 0 2 4 11 52 74<br />
Number of independent environment audits 65 60 42 59 46 37<br />
Number of occupational health and safety audits 44 52 42 58 46 37<br />
Number of equipment safety audits 86 75 115 116 110 97<br />
Number of security audits 74 98 51 71 42 51<br />
Number of hours of environment training (total plant) 29,229 34,907 38,979 36,938 37,386 33,458<br />
Total volume of water consumption (thousand m 3 ) 6,334 5,201 5,032 3,262 3,463 3,377<br />
Total volume of water consumption/sales (m 3 /€) 579 540 514 303 341 367<br />
Total energy consumption (GWh) 1,758 1,678 1,739 1,814 1,868 1,861<br />
Total energy consumption/sales (MWh/€ millions) 158 174 179 171 185 202<br />
Electricity (%) 60 60 58 63 64 64<br />
Gas (%) 31 32 33 34 34 32<br />
Fuel oil (%) 4 2 6 2 2 1<br />
Other energies (%) 5 6 3 1 0 0<br />
Use of chlorinated solvents (tonnes) 2,288 848 1,469 1,171 1,096 739<br />
Use of chlorinated solvents/sales (kg/€ millions) 212 88 153 109 107 80<br />
Use of heavy metals (tonnes) 1,396 415 274 296 294 131<br />
Use of heavy metals/sales (kg/€ millions) 133 43 28 28 29 14<br />
Use of CMR substances (tonnes) 1,947 N/A 1,062 1,049 1,138 406<br />
Use of CMR substances/sales (kg/€ millions) 192 N/A 107 98 111 44<br />
Use of packaging materials (tonnes) 59,301 51,903 48,606 67,239 63,248 72,065<br />
Use of packaging materials/sales (kg/€ millions) 7,293 5,389 5,503 6,741 6,669 7,882<br />
Proportion of plastic packaging (%) 11 7 8 17 10 10<br />
Proportion of cardboard packaging (%) 49 60 48 53 57 58<br />
Proportion of wooden packaging (%) 40 33 44 29 32 31<br />
Proportion of other packaging materials (%) 0 0 0 1 1 2<br />
Use of recycled plastics (tonnes) 10,026 10,420 6,219 5,020 6,150 7,184<br />
Volume of industrial effluent emissions (thousand m 3 ) 1,174 940 1,009 695 748 918<br />
Volume of industrial effluent emissions/sales (m 3 /€ millions) 104 98 102 65 76 103<br />
Heavy metal content in effluent (kg) 859 1,196 365 208 278 242<br />
Heavy metal content in effluent/sales (kg/€ millions) 0 0 0 0 0 0<br />
VOC atmospheric emissions (tonnes) 2,473 2,931 1,242 1,708 1,489 1,296<br />
VOC atmospheric emissions/sales (kg/€ millions) 329 304 143 162 153 141<br />
TCE atmospheric emissions (tonnes) 1,740 917 536 465 327 51<br />
TCE atmospheric emissions/sales (kg/€ millions) 178 92 54 44 32 6<br />
Lead atmospheric emissions (kg) 167 270 130 72 52 173<br />
Lead atmospheric emissions/sales (g/€ millions) 19 27 13 7 5 20<br />
Greenhouse gas emissions (tonnes CO 2 equiv) 122,011 107,035 112,195 121,157 123,971 122,151<br />
Greenhouse gas emissions/sales (tonnes CO 2 equiv/€ millions) 11 11 12 11 12 13<br />
Total waste produced (tonnes) 139,707 112,054 123,216 132,725 138,772 159,223<br />
Total waste produced/sales (tonnes/€ millions) 13 12 13 12 14 17<br />
Hazardous waste (tonnes) 29,975 30,121 20,924 23,102 23,296 20,485<br />
Non-hazardous waste (tonnes) 109,495 80,854 102,755 109,628 115,498 138,738<br />
Waste reuse rate (%) 62 62 59 71 72 74<br />
Number of fines and compensation awards N/A N/A 5 5 3 1<br />
Amount of fines and compensation awards (€ thousands) N/A N/A 25 16 4 1<br />
Provisions and guarantees for environmental risks (€ thousands)<br />
Functional expenditure to prevent environmental impact of operations<br />
N/A N/A 7,580 8,054 3,091 4,289<br />
(€ thousands)<br />
Investments (excluding decontamination work) to prevent<br />
N/A N/A 14,140 13,861 16,417 19,789<br />
environmental impact of operations (€ thousands) N/A N/A 5,624 7,205 4,244 3,552<br />
Decontamination cost (€ thousands) N/A N/A 869 1,467 1,240 1,427<br />
1<br />
2<br />
3<br />
4<br />
5<br />
6