2007 Reference document (PDF) - Valeo
2007 Reference document (PDF) - Valeo
2007 Reference document (PDF) - Valeo

Create successful ePaper yourself
Turn your PDF publications into a flip-book with our unique Google optimized e-Paper software.
3 Consolidated<br />
PAGE 94<br />
fi nancial statements at December 31, <strong>2007</strong><br />
Notes to consolidated financial statements<br />
2.2.4. Sale of Zexel Logitec Company<br />
On June 30, 2006, <strong>Valeo</strong> sold Zexel Logitec Company. The contribution<br />
of this company to Group net sales amounted to 30 million euros<br />
in 2006 (over the period from January 1 to June 30) and 53 million<br />
euros in 2005. The capital gain recognized by the Group in “Other<br />
income and expenses” for 2006 amounted to 14 million euros.<br />
<strong>2007</strong> <strong>Reference</strong> <strong>document</strong> - VALEO<br />
2.2.5. <strong>Valeo</strong> Raytheon Systems Inc.<br />
<strong>Valeo</strong> continued to invest in Raytheon Systems Inc., increasing its stake<br />
from 73.1% at December 31, 2005 to 77.2% at December 31, 2006.<br />
<strong>Valeo</strong> owns Raytheon Systems Inc. jointly with the Raytheon Group,<br />
and accounts for its interest by the proportional consolidation method<br />
because of the characteristics of the partnership agreement.<br />
2.3. Impact of changes in scope of consolidation on the statement of income, statement of cash<br />
fl ows and balance sheet<br />
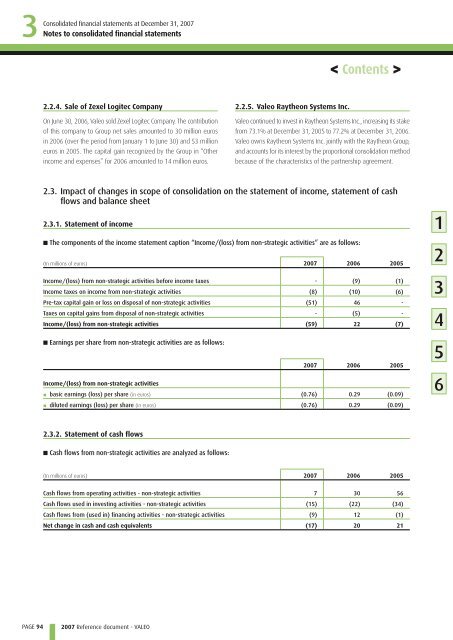
2.3.1. Statement of income<br />
■ The components of the income statement caption “Income/(loss) from non-strategic activities” are as follows:<br />
(In millions of euros) <strong>2007</strong> 2006 2005<br />
Income/(loss) from non-strategic activities before income taxes - (9) (1)<br />
Income taxes on income from non-strategic activities (8) (10) (6)<br />
Pre-tax capital gain or loss on disposal of non-strategic activities (51) 46 -<br />
Taxes on capital gains from disposal of non-strategic activities - (5) -<br />
Income/(loss) from non-strategic activities (59) 22 (7)<br />
■ Earnings per share from non-strategic activities are as follows:<br />
Income/(loss) from non-strategic activities<br />
<strong>2007</strong> 2006 2005<br />
▪ b asic earnings (loss) per share (in euros)<br />
(0.76) 0.29 (0.09)<br />
▪ d iluted earnings (loss) per share (in euros)<br />
(0.76) 0.29 (0.09)<br />
2.3.2. Statement of cash flows<br />
■ Cash flows from non-strategic activities are analyzed as follows:<br />
< Contents ><br />
(In millions of euros) <strong>2007</strong> 2006 2005<br />
Cash flows from operating activities - non-strategic activities 7 30 56<br />
Cash flows used in investing activities - non-strategic activities (15) (22) (34)<br />
Cash flows from (used in) financing activities - non-strategic activities (9) 12 (1)<br />
Net change in cash and cash equivalents (17) 20 21<br />
1<br />
2<br />
3<br />
4<br />
5<br />
6