Ethnic Hostility among Ethnic Majority and Minority Groups
Ethnic Hostility among Ethnic Majority and Minority Groups
Ethnic Hostility among Ethnic Majority and Minority Groups

Create successful ePaper yourself
Turn your PDF publications into a flip-book with our unique Google optimized e-Paper software.
5. Trends in <strong>Ethnic</strong> Educational Inequality | Analyses <strong>and</strong> results<br />
order parameters of the saturated model (i.e. the ESC parameters) tell us whether an ‘<strong>Ethnic</strong>ity by<br />
Schooling’ association that belongs to a specifi c birth cohort deviates from the mean (over birth<br />
cohorts) ‘<strong>Ethnic</strong>ity by Schooling’ association. 4<br />
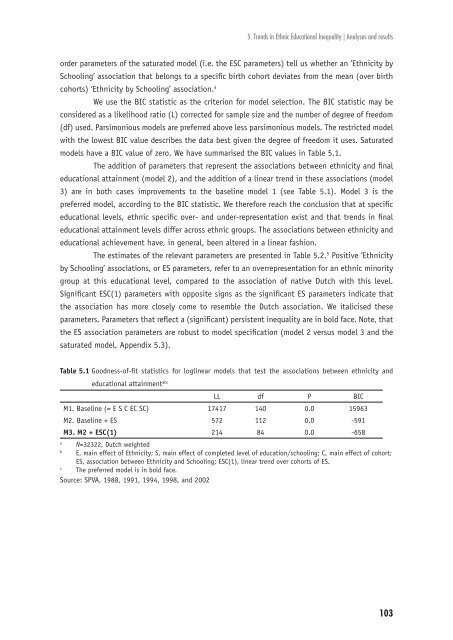
We use the BIC statistic as the criterion for model selection. The BIC statistic may be<br />
considered as a likelihood ratio (L) corrected for sample size <strong>and</strong> the number of degree of freedom<br />
(df) used. Parsimonious models are preferred above less parsimonious models. The restricted model<br />
with the lowest BIC value describes the data best given the degree of freedom it uses. Saturated<br />
models have a BIC value of zero. We have summarised the BIC values in Table 5.1.<br />
The addition of parameters that represent the associations between ethnicity <strong>and</strong> fi nal<br />
educational attainment (model 2), <strong>and</strong> the addition of a linear trend in these associations (model<br />
3) are in both cases improvements to the baseline model 1 (see Table 5.1). Model 3 is the<br />
preferred model, according to the BIC statistic. We therefore reach the conclusion that at specifi c<br />
educational levels, ethnic specifi c over- <strong>and</strong> under-representation exist <strong>and</strong> that trends in fi nal<br />
educational attainment levels differ across ethnic groups. The associations between ethnicity <strong>and</strong><br />
educational achievement have, in general, been altered in a linear fashion.<br />
The estimates of the relevant parameters are presented in Table 5.2. 5 Positive ‘<strong>Ethnic</strong>ity<br />
by Schooling’ associations, or ES parameters, refer to an overrepresentation for an ethnic minority<br />
group at this educational level, compared to the association of native Dutch with this level.<br />
Signifi cant ESC(1) parameters with opposite signs as the signifi cant ES parameters indicate that<br />
the association has more closely come to resemble the Dutch association. We italicised these<br />
parameters. Parameters that refl ect a (signifi cant) persistent inequality are in bold face. Note, that<br />
the ES association parameters are robust to model specifi cation (model 2 versus model 3 <strong>and</strong> the<br />
saturated model, Appendix 5.3).<br />
Table 5.1 Goodness-of-fi t statistics for loglinear models that test the associations between ethnicity <strong>and</strong><br />
educational attainmentabc LL df P BIC<br />
M1. Baseline (= E S C EC SC) 17417 140 0.0 15963<br />
M2. Baseline + ES 572 112 0.0 -591<br />
M3. M2 + ESC(1) 214 84 0.0 -658<br />
a N=32322, Dutch weighted<br />
b E, main effect of <strong>Ethnic</strong>ity; S, main effect of completed level of education/schooling; C, main effect of cohort;<br />
ES, association between <strong>Ethnic</strong>ity <strong>and</strong> Schooling; ESC(1), linear trend over cohorts of ES.<br />
c The preferred model is in bold face.<br />
Source: SPVA, 1988, 1991, 1994, 1998, <strong>and</strong> 2002<br />
103