Ethnic Hostility among Ethnic Majority and Minority Groups
Ethnic Hostility among Ethnic Majority and Minority Groups
Ethnic Hostility among Ethnic Majority and Minority Groups

You also want an ePaper? Increase the reach of your titles
YUMPU automatically turns print PDFs into web optimized ePapers that Google loves.
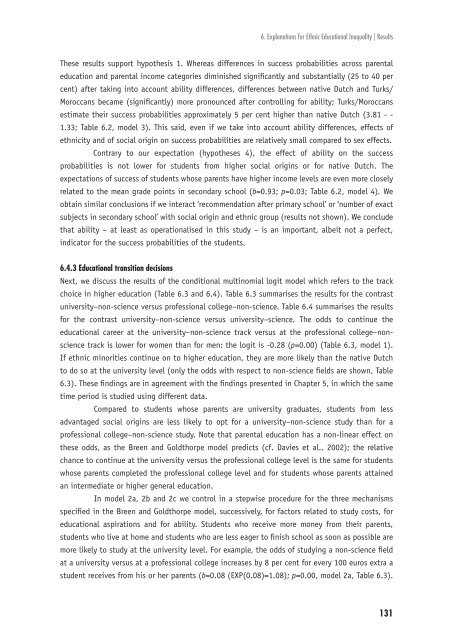
6. Explanations for <strong>Ethnic</strong> Educational Inequality | Results<br />
These results support hypothesis 1. Whereas differences in success probabilities across parental<br />
education <strong>and</strong> parental income categories diminished signifi cantly <strong>and</strong> substantially (25 to 40 per<br />
cent) after taking into account ability differences, differences between native Dutch <strong>and</strong> Turks/<br />
Moroccans became (signifi cantly) more pronounced after controlling for ability; Turks/Moroccans<br />
estimate their success probabilities approximately 5 per cent higher than native Dutch (3.81 - -<br />
1.33; Table 6.2, model 3). This said, even if we take into account ability differences, effects of<br />
ethnicity <strong>and</strong> of social origin on success probabilities are relatively small compared to sex effects.<br />
Contrary to our expectation (hypotheses 4), the effect of ability on the success<br />
probabilities is not lower for students from higher social origins or for native Dutch. The<br />
expectations of success of students whose parents have higher income levels are even more closely<br />
related to the mean grade points in secondary school (b=0.93; p=0.03; Table 6.2, model 4). We<br />
obtain similar conclusions if we interact ‘recommendation after primary school’ or ‘number of exact<br />
subjects in secondary school’ with social origin <strong>and</strong> ethnic group (results not shown). We conclude<br />
that ability – at least as operationalised in this study – is an important, albeit not a perfect,<br />
indicator for the success probabilities of the students.<br />
6.4.3 Educational transition decisions<br />
Next, we discuss the results of the conditional multinomial logit model which refers to the track<br />
choice in higher education (Table 6.3 <strong>and</strong> 6.4). Table 6.3 summarises the results for the contrast<br />
university–non-science versus professional college–non-science. Table 6.4 summarises the results<br />
for the contrast university–non-science versus university–science. The odds to continue the<br />
educational career at the university–non-science track versus at the professional college–nonscience<br />
track is lower for women than for men: the logit is -0.28 (p=0.00) (Table 6.3, model 1).<br />
If ethnic minorities continue on to higher education, they are more likely than the native Dutch<br />
to do so at the university level (only the odds with respect to non-science fi elds are shown, Table<br />
6.3). These fi ndings are in agreement with the fi ndings presented in Chapter 5, in which the same<br />
time period is studied using different data.<br />
Compared to students whose parents are university graduates, students from less<br />
advantaged social origins are less likely to opt for a university–non-science study than for a<br />
professional college–non-science study. Note that parental education has a non-linear effect on<br />
these odds, as the Breen <strong>and</strong> Goldthorpe model predicts (cf. Davies et al., 2002); the relative<br />
chance to continue at the university versus the professional college level is the same for students<br />
whose parents completed the professional college level <strong>and</strong> for students whose parents attained<br />
an intermediate or higher general education.<br />
In model 2a, 2b <strong>and</strong> 2c we control in a stepwise procedure for the three mechanisms<br />
specifi ed in the Breen <strong>and</strong> Goldthorpe model, successively, for factors related to study costs, for<br />
educational aspirations <strong>and</strong> for ability. Students who receive more money from their parents,<br />
students who live at home <strong>and</strong> students who are less eager to fi nish school as soon as possible are<br />
more likely to study at the university level. For example, the odds of studying a non-science fi eld<br />
at a university versus at a professional college increases by 8 per cent for every 100 euros extra a<br />
student receives from his or her parents (b=0.08 (EXP(0.08)=1.08); p=0.00, model 2a, Table 6.3).<br />
131