Ethnic Hostility among Ethnic Majority and Minority Groups
Ethnic Hostility among Ethnic Majority and Minority Groups
Ethnic Hostility among Ethnic Majority and Minority Groups

Create successful ePaper yourself
Turn your PDF publications into a flip-book with our unique Google optimized e-Paper software.
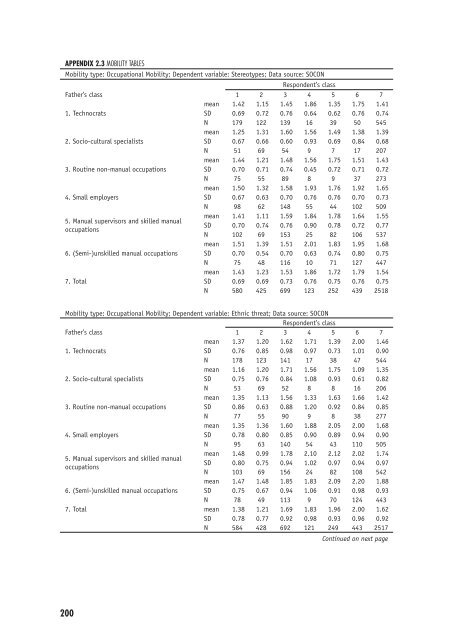
APPENDIX 2.3 MOBILITY TABLES<br />
Mobility type: Occupational Mobility; Dependent variable: Stereotypes; Data source: SOCON<br />
Respondent’s class<br />
Father’s class 1 2 3 4 5 6 7<br />
mean 1.42 1.15 1.45 1.86 1.35 1.75 1.41<br />
1. Technocrats<br />
SD 0.69 0.72 0.76 0.64 0.62 0.76 0.74<br />
N 179 122 139 16 39 50 545<br />
mean 1.25 1.31 1.60 1.56 1.49 1.38 1.39<br />
2. Socio-cultural specialists<br />
SD 0.67 0.66 0.60 0.93 0.69 0.84 0.68<br />
N 51 69 54 9 7 17 207<br />
mean 1.44 1.21 1.48 1.56 1.75 1.51 1.43<br />
3. Routine non-manual occupations<br />
SD 0.70 0.71 0.74 0.45 0.72 0.71 0.72<br />
N 75 55 89 8 9 37 273<br />
mean 1.50 1.32 1.58 1.93 1.76 1.92 1.65<br />
4. Small employers<br />
SD 0.67 0.63 0.70 0.76 0.76 0.70 0.73<br />
N 98 62 148 55 44 102 509<br />
5. Manual supervisors <strong>and</strong> skilled manual<br />
occupations<br />
6. (Semi-)unskilled manual occupations<br />
7. Total<br />
200<br />
mean 1.41 1.11 1.59 1.84 1.78 1.64 1.55<br />
SD 0.70 0.74 0.76 0.90 0.78 0.72 0.77<br />
N 102 69 153 25 82 106 537<br />
mean 1.51 1.39 1.51 2.01 1.83 1.95 1.68<br />
SD 0.70 0.54 0.70 0.63 0.74 0.80 0.75<br />
N 75 48 116 10 71 127 447<br />
mean 1.43 1.23 1.53 1.86 1.72 1.79 1.54<br />
SD 0.69 0.69 0.73 0.76 0.75 0.76 0.75<br />
N 580 425 699 123 252 439 2518<br />
Mobility type: Occupational Mobility; Dependent variable: <strong>Ethnic</strong> threat; Data source: SOCON<br />
Respondent’s class<br />
Father’s class 1 2 3 4 5 6 7<br />
mean 1.37 1.20 1.62 1.71 1.39 2.00 1.46<br />
1. Technocrats<br />
SD 0.76 0.85 0.98 0.97 0.73 1.01 0.90<br />
N 178 123 141 17 38 47 544<br />
mean 1.16 1.20 1.71 1.56 1.75 1.09 1.35<br />
2. Socio-cultural specialists<br />
SD 0.75 0.76 0.84 1.08 0.93 0.61 0.82<br />
N 53 69 52 8 8 16 206<br />
mean 1.35 1.13 1.56 1.33 1.63 1.66 1.42<br />
3. Routine non-manual occupations<br />
SD 0.86 0.63 0.88 1.20 0.92 0.84 0.85<br />
N 77 55 90 9 8 38 277<br />
mean 1.35 1.36 1.60 1.88 2.05 2.00 1.68<br />
4. Small employers<br />
SD 0.78 0.80 0.85 0.90 0.89 0.94 0.90<br />
N 95 63 140 54 43 110 505<br />
5. Manual supervisors <strong>and</strong> skilled manual<br />
occupations<br />
6. (Semi-)unskilled manual occupations<br />
mean 1.48 0.99 1.78 2.10 2.12 2.02 1.74<br />
SD 0.80 0.75 0.94 1.02 0.97 0.94 0.97<br />
N 103 69 156 24 82 108 542<br />
mean 1.47 1.48 1.85 1.83 2.09 2.20 1.88<br />
SD 0.75 0.67 0.94 1.06 0.91 0.98 0.93<br />
N 78 49 113 9 70 124 443<br />
7. Total mean 1.38 1.21 1.69 1.83 1.96 2.00 1.62<br />
SD 0.78 0.77 0.92 0.98 0.93 0.96 0.92<br />
N 584 428 692 121 249 443 2517<br />
Continued on next page