Ethnic Hostility among Ethnic Majority and Minority Groups
Ethnic Hostility among Ethnic Majority and Minority Groups
Ethnic Hostility among Ethnic Majority and Minority Groups

Create successful ePaper yourself
Turn your PDF publications into a flip-book with our unique Google optimized e-Paper software.
2.4 RESULTS<br />
2. Social Mobility <strong>and</strong> <strong>Ethnic</strong> <strong>Hostility</strong> | Results<br />
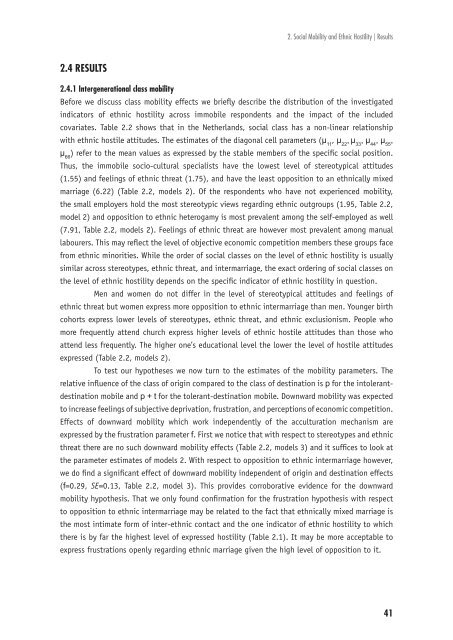
2.4.1 Intergenerational class mobility<br />
Before we discuss class mobility effects we briefl y describe the distribution of the investigated<br />
indicators of ethnic hostility across immobile respondents <strong>and</strong> the impact of the included<br />
covariates. Table 2.2 shows that in the Netherl<strong>and</strong>s, social class has a non-linear relationship<br />
with ethnic hostile attitudes. The estimates of the diagonal cell parameters (μ , μ , μ , μ , μ ,<br />
11 22 33 44 55<br />
μ ) refer to the mean values as expressed by the stable members of the specifi c social position.<br />
66<br />
Thus, the immobile socio-cultural specialists have the lowest level of stereotypical attitudes<br />
(1.55) <strong>and</strong> feelings of ethnic threat (1.75), <strong>and</strong> have the least opposition to an ethnically mixed<br />
marriage (6.22) (Table 2.2, models 2). Of the respondents who have not experienced mobility,<br />
the small employers hold the most stereotypic views regarding ethnic outgroups (1.95, Table 2.2,<br />
model 2) <strong>and</strong> opposition to ethnic heterogamy is most prevalent <strong>among</strong> the self-employed as well<br />
(7.91, Table 2.2, models 2). Feelings of ethnic threat are however most prevalent <strong>among</strong> manual<br />
labourers. This may refl ect the level of objective economic competition members these groups face<br />
from ethnic minorities. While the order of social classes on the level of ethnic hostility is usually<br />
similar across stereotypes, ethnic threat, <strong>and</strong> intermarriage, the exact ordering of social classes on<br />
the level of ethnic hostility depends on the specifi c indicator of ethnic hostility in question.<br />
Men <strong>and</strong> women do not differ in the level of stereotypical attitudes <strong>and</strong> feelings of<br />
ethnic threat but women express more opposition to ethnic intermarriage than men. Younger birth<br />
cohorts express lower levels of stereotypes, ethnic threat, <strong>and</strong> ethnic exclusionism. People who<br />
more frequently attend church express higher levels of ethnic hostile attitudes than those who<br />
attend less frequently. The higher one’s educational level the lower the level of hostile attitudes<br />
expressed (Table 2.2, models 2).<br />
To test our hypotheses we now turn to the estimates of the mobility parameters. The<br />
relative infl uence of the class of origin compared to the class of destination is p for the intolerantdestination<br />
mobile <strong>and</strong> p + t for the tolerant-destination mobile. Downward mobility was expected<br />
to increase feelings of subjective deprivation, frustration, <strong>and</strong> perceptions of economic competition.<br />
Effects of downward mobility which work independently of the acculturation mechanism are<br />
expressed by the frustration parameter f. First we notice that with respect to stereotypes <strong>and</strong> ethnic<br />
threat there are no such downward mobility effects (Table 2.2, models 3) <strong>and</strong> it suffi ces to look at<br />
the parameter estimates of models 2. With respect to opposition to ethnic intermarriage however,<br />
we do fi nd a signifi cant effect of downward mobility independent of origin <strong>and</strong> destination effects<br />
(f=0.29, SE=0.13, Table 2.2, model 3). This provides corroborative evidence for the downward<br />
mobility hypothesis. That we only found confi rmation for the frustration hypothesis with respect<br />
to opposition to ethnic intermarriage may be related to the fact that ethnically mixed marriage is<br />
the most intimate form of inter-ethnic contact <strong>and</strong> the one indicator of ethnic hostility to which<br />
there is by far the highest level of expressed hostility (Table 2.1). It may be more acceptable to<br />
express frustrations openly regarding ethnic marriage given the high level of opposition to it.<br />
41