Ethnic Hostility among Ethnic Majority and Minority Groups
Ethnic Hostility among Ethnic Majority and Minority Groups
Ethnic Hostility among Ethnic Majority and Minority Groups
Create successful ePaper yourself
Turn your PDF publications into a flip-book with our unique Google optimized e-Paper software.
7.4 RESULTS<br />
7.4.1 Bivariate relationships<br />
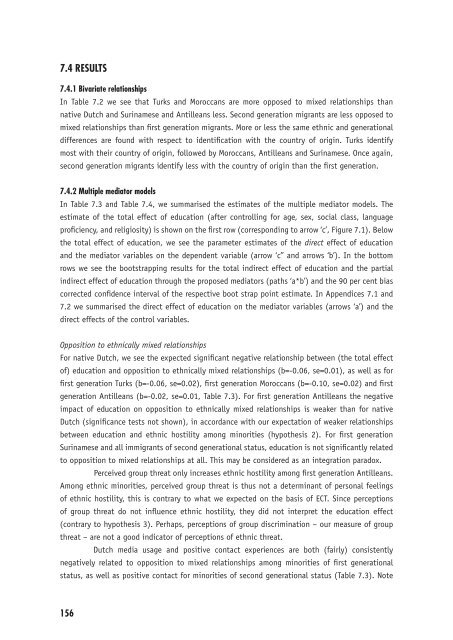
In Table 7.2 we see that Turks <strong>and</strong> Moroccans are more opposed to mixed relationships than<br />
native Dutch <strong>and</strong> Surinamese <strong>and</strong> Antilleans less. Second generation migrants are less opposed to<br />
mixed relationships than fi rst generation migrants. More or less the same ethnic <strong>and</strong> generational<br />
differences are found with respect to identifi cation with the country of origin. Turks identify<br />
most with their country of origin, followed by Moroccans, Antilleans <strong>and</strong> Surinamese. Once again,<br />
second generation migrants identify less with the country of origin than the fi rst generation.<br />
7.4.2 Multiple mediator models<br />
In Table 7.3 <strong>and</strong> Table 7.4, we summarised the estimates of the multiple mediator models. The<br />
estimate of the total effect of education (after controlling for age, sex, social class, language<br />
profi ciency, <strong>and</strong> religiosity) is shown on the fi rst row (corresponding to arrow ‘c’, Figure 7.1). Below<br />
the total effect of education, we see the parameter estimates of the direct effect of education<br />
<strong>and</strong> the mediator variables on the dependent variable (arrow ‘c’’ <strong>and</strong> arrows ‘b’). In the bottom<br />
rows we see the bootstrapping results for the total indirect effect of education <strong>and</strong> the partial<br />
indirect effect of education through the proposed mediators (paths ‘a*b’) <strong>and</strong> the 90 per cent bias<br />
corrected confi dence interval of the respective boot strap point estimate. In Appendices 7.1 <strong>and</strong><br />
7.2 we summarised the direct effect of education on the mediator variables (arrows ‘a’) <strong>and</strong> the<br />
direct effects of the control variables.<br />
Opposition to ethnically mixed relationships<br />
For native Dutch, we see the expected signifi cant negative relationship between (the total effect<br />
of) education <strong>and</strong> opposition to ethnically mixed relationships (b=-0.06, se=0.01), as well as for<br />
fi rst generation Turks (b=-0.06, se=0.02), fi rst generation Moroccans (b=-0.10, se=0.02) <strong>and</strong> fi rst<br />
generation Antilleans (b=-0.02, se=0.01, Table 7.3). For fi rst generation Antilleans the negative<br />
impact of education on opposition to ethnically mixed relationships is weaker than for native<br />
Dutch (signifi cance tests not shown), in accordance with our expectation of weaker relationships<br />
between education <strong>and</strong> ethnic hostility <strong>among</strong> minorities (hypothesis 2). For fi rst generation<br />
Surinamese <strong>and</strong> all immigrants of second generational status, education is not signifi cantly related<br />
to opposition to mixed relationships at all. This may be considered as an integration paradox.<br />
Perceived group threat only increases ethnic hostility <strong>among</strong> fi rst generation Antilleans.<br />
Among ethnic minorities, perceived group threat is thus not a determinant of personal feelings<br />
of ethnic hostility, this is contrary to what we expected on the basis of ECT. Since perceptions<br />
of group threat do not infl uence ethnic hostility, they did not interpret the education effect<br />
(contrary to hypothesis 3). Perhaps, perceptions of group discrimination – our measure of group<br />
threat – are not a good indicator of perceptions of ethnic threat.<br />
Dutch media usage <strong>and</strong> positive contact experiences are both (fairly) consistently<br />
negatively related to opposition to mixed relationships <strong>among</strong> minorities of fi rst generational<br />
status, as well as positive contact for minorities of second generational status (Table 7.3). Note<br />
156


