Ethnic Hostility among Ethnic Majority and Minority Groups
Ethnic Hostility among Ethnic Majority and Minority Groups
Ethnic Hostility among Ethnic Majority and Minority Groups
You also want an ePaper? Increase the reach of your titles
YUMPU automatically turns print PDFs into web optimized ePapers that Google loves.
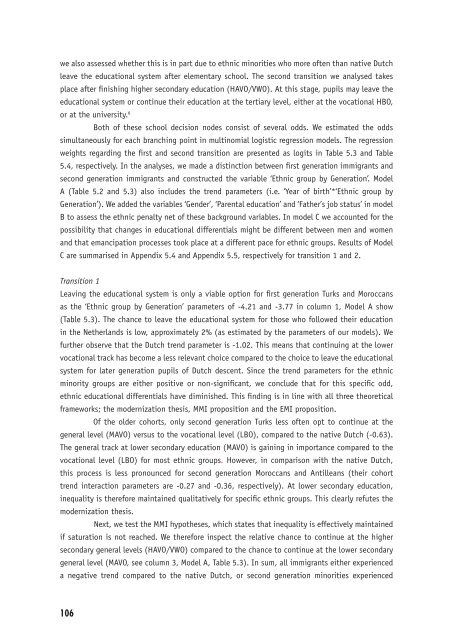
we also assessed whether this is in part due to ethnic minorities who more often than native Dutch<br />
leave the educational system after elementary school. The second transition we analysed takes<br />
place after fi nishing higher secondary education (HAVO/VWO). At this stage, pupils may leave the<br />
educational system or continue their education at the tertiary level, either at the vocational HBO,<br />
or at the university. 6<br />
Both of these school decision nodes consist of several odds. We estimated the odds<br />
simultaneously for each branching point in multinomial logistic regression models. The regression<br />
weights regarding the fi rst <strong>and</strong> second transition are presented as logits in Table 5.3 <strong>and</strong> Table<br />
5.4, respectively. In the analyses, we made a distinction between fi rst generation immigrants <strong>and</strong><br />
second generation immigrants <strong>and</strong> constructed the variable ‘<strong>Ethnic</strong> group by Generation’. Model<br />
A (Table 5.2 <strong>and</strong> 5.3) also includes the trend parameters (i.e. ‘Year of birth’*‘<strong>Ethnic</strong> group by<br />
Generation’). We added the variables ‘Gender’, ‘Parental education’ <strong>and</strong> ‘Father’s job status’ in model<br />
B to assess the ethnic penalty net of these background variables. In model C we accounted for the<br />
possibility that changes in educational differentials might be different between men <strong>and</strong> women<br />
<strong>and</strong> that emancipation processes took place at a different pace for ethnic groups. Results of Model<br />
C are summarised in Appendix 5.4 <strong>and</strong> Appendix 5.5, respectively for transition 1 <strong>and</strong> 2.<br />
Transition 1<br />
Leaving the educational system is only a viable option for fi rst generation Turks <strong>and</strong> Moroccans<br />
as the ‘<strong>Ethnic</strong> group by Generation’ parameters of -4.21 <strong>and</strong> -3.77 in column 1, Model A show<br />
(Table 5.3). The chance to leave the educational system for those who followed their education<br />
in the Netherl<strong>and</strong>s is low, approximately 2% (as estimated by the parameters of our models). We<br />
further observe that the Dutch trend parameter is -1.02. This means that continuing at the lower<br />
vocational track has become a less relevant choice compared to the choice to leave the educational<br />
system for later generation pupils of Dutch descent. Since the trend parameters for the ethnic<br />
minority groups are either positive or non-signifi cant, we conclude that for this specifi c odd,<br />
ethnic educational differentials have diminished. This fi nding is in line with all three theoretical<br />
frameworks; the modernization thesis, MMI proposition <strong>and</strong> the EMI proposition.<br />
Of the older cohorts, only second generation Turks less often opt to continue at the<br />
general level (MAVO) versus to the vocational level (LBO), compared to the native Dutch (-0.63).<br />
The general track at lower secondary education (MAVO) is gaining in importance compared to the<br />
vocational level (LBO) for most ethnic groups. However, in comparison with the native Dutch,<br />
this process is less pronounced for second generation Moroccans <strong>and</strong> Antilleans (their cohort<br />
trend interaction parameters are -0.27 <strong>and</strong> -0.36, respectively). At lower secondary education,<br />
inequality is therefore maintained qualitatively for specifi c ethnic groups. This clearly refutes the<br />
modernization thesis.<br />
Next, we test the MMI hypotheses, which states that inequality is effectively maintained<br />
if saturation is not reached. We therefore inspect the relative chance to continue at the higher<br />
secondary general levels (HAVO/VWO) compared to the chance to continue at the lower secondary<br />
general level (MAVO, see column 3, Model A, Table 5.3). In sum, all immigrants either experienced<br />
a negative trend compared to the native Dutch, or second generation minorities experienced<br />
106


