- Page 1 and 2: ETHNIC HOSTILITY AMONG ETHNIC MAJOR
- Page 3: Promotores: prof. dr. N. D. de Graa
- Page 6 and 7: Science is so much more fun when yo
- Page 8 and 9: 3.4.1 Opposition to ethnic intermar
- Page 10: 8.3.1 Theoretical implications for
- Page 14 and 15: 1. INTRODUCTION 1.1 NEW QUESTIONS 1
- Page 16 and 17: 1. Introduction | New questions ski
- Page 18 and 19: 1. Introduction | The setting of th
- Page 20 and 21: 1. Introduction | Research question
- Page 22 and 23: 1. Introduction | Research question
- Page 24 and 25: 1. Introduction | Research question
- Page 26 and 27: Table 1.1 Outline of empirical chap
- Page 28: 1. Introduction | Notes 27
- Page 32 and 33: 2. SOCIAL MOBILITY AND ETHNIC HOSTI
- Page 34 and 35: 2. Social Mobility and Ethnic Hosti
- Page 36 and 37: social conformity favour more toler
- Page 38 and 39: 2. Social Mobility and Ethnic Hosti
- Page 42 and 43: 2.4 RESULTS 2. Social Mobility and
- Page 44 and 45: 2. Social Mobility and Ethnic Hosti
- Page 46 and 47: 2. Social Mobility and Ethnic Hosti
- Page 48: 2. Social Mobility and Ethnic Hosti
- Page 51 and 52: 1987). Assessment of the importance
- Page 53 and 54: The actual ethnic competition withi
- Page 55 and 56: (Pettigrew & Tropp, 2006). Wagner e
- Page 57 and 58: seven categories: no-religion, Roma
- Page 59 and 60: the lower the opposition to ethnic
- Page 61 and 62: Table 3.1 Hierarchical linear inter
- Page 63 and 64: Table 3.2 Hierarchical linear inter
- Page 65 and 66: In model 8 we focus on the characte
- Page 67 and 68: Table 3.3 Comparison of explanatory
- Page 69 and 70: 3.5 CONCLUSIONS We observed a weak
- Page 71 and 72: 9. The models presented in this cha
- Page 74 and 75: 4. THE LOCAL LIVING ENVIRONMENT AND
- Page 76 and 77: unit such as states or countries, w
- Page 78 and 79: 4. The Local Living Environment and
- Page 80 and 81: 4. The Local Living Environment and
- Page 82 and 83: 4. The Local Living Environment and
- Page 84 and 85: 4.4 RESULTS 4. The Local Living Env
- Page 86 and 87: Table 4.2 continued Household compo
- Page 88 and 89: 4. The Local Living Environment and
- Page 90 and 91:
4. The Local Living Environment and
- Page 92:
4. The Local Living Environment and
- Page 96 and 97:
5. TRENDS IN ETHNIC EDUCATIONAL INE
- Page 98 and 99:
5. Trends in Ethnic Educational Ine
- Page 100 and 101:
5. Trends in Ethnic Educational Ine
- Page 102 and 103:
the worsening economic conditions o
- Page 104 and 105:
5. Trends in Ethnic Educational Ine
- Page 106 and 107:
5. Trends in Ethnic Educational Ine
- Page 108 and 109:
5. Trends in Ethnic Educational Ine
- Page 110 and 111:
Table 5.3 continued Male (Female=re
- Page 112 and 113:
Table 5.4 continued Male (Female= r
- Page 114 and 115:
5. Trends in Ethnic Educational Ine
- Page 116 and 117:
5. Trends in Ethnic Educational Ine
- Page 118 and 119:
6. EXPLANATIONS FOR ETHNIC EDUCATIO
- Page 120 and 121:
To answer our research questions, w
- Page 122 and 123:
6. Explanations for Ethnic Educatio
- Page 124 and 125:
6. Explanations for Ethnic Educatio
- Page 126 and 127:
Table 6.1 continued Pre-university
- Page 128 and 129:
6. Explanations for Ethnic Educatio
- Page 130 and 131:
Table 6.2 continued Lower general t
- Page 132 and 133:
6. Explanations for Ethnic Educatio
- Page 134 and 135:
6. Explanations for Ethnic Educatio
- Page 136 and 137:
6. Explanations for Ethnic Educatio
- Page 138 and 139:
Model 4 includes both the ability m
- Page 140 and 141:
6. Explanations for Ethnic Educatio
- Page 142 and 143:
6. Explanations for Ethnic Educatio
- Page 144 and 145:
7. EDUCATIONAL ATTAINMENT AND ETHNI
- Page 146 and 147:
among four ethnic minority groups i
- Page 148 and 149:
7. Educational Attainment and Ethni
- Page 150 and 151:
7. Educational Attainment and Ethni
- Page 152 and 153:
Table 7.1 Summary of hypotheses Cor
- Page 154 and 155:
7. Educational Attainment and Ethni
- Page 156 and 157:
Table 7.2 continued Control variabl
- Page 158 and 159:
7. Educational Attainment and Ethni
- Page 160 and 161:
Table 7.3 continued 2nd gen. Turks
- Page 162 and 163:
7. Educational Attainment and Ethni
- Page 164 and 165:
Table 7.4 continued 2nd gen. Turks
- Page 166 and 167:
7. Educational Attainment and Ethni
- Page 168:
7. Educational Attainment and Ethni
- Page 172 and 173:
8. CONCLUSION 8.1 INTRODUCTION 8. C
- Page 174 and 175:
8.2 QUESTIONS, RESULTS AND CONCLUSI
- Page 176 and 177:
8. Conclusion | Questions, results
- Page 178 and 179:
8. Conclusion | Questions, results
- Page 180 and 181:
8. Conclusion | Questions, results
- Page 182 and 183:
local living environments (on ethni
- Page 184 and 185:
8. Conclusion | Questions, results
- Page 186 and 187:
8. Conclusion | Questions, results
- Page 188 and 189:
8. Conclusion | Questions, results
- Page 190 and 191:
8. Conclusion | Theoretical implica
- Page 192 and 193:
ethnic hosting threat contact / res
- Page 194 and 195:
8. Conclusion | Retrospect and pros
- Page 196 and 197:
8. Conclusion | Notes 195
- Page 198 and 199:
APPENDIX Appendix 197
- Page 200 and 201:
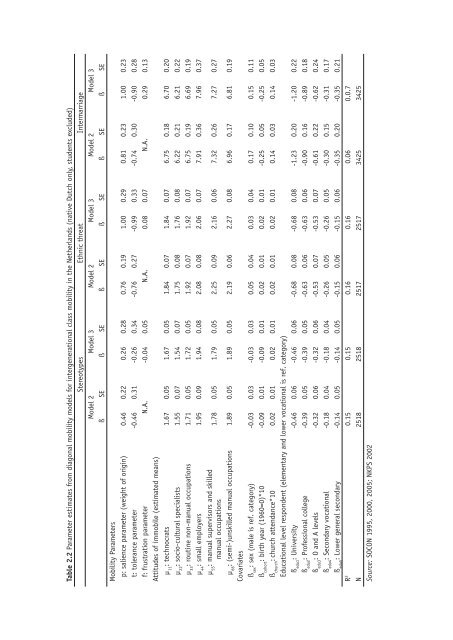
APPENDIX 2.2 DESCRIPTIVE STATISTICS
- Page 202 and 203:
Appendix 2.3 continued Mobility typ
- Page 204 and 205:
APPENDIX 2.4 TUTORIAL DIAGONAL MOBI
- Page 206 and 207:
*********MEANS and OLS***********.
- Page 208 and 209:
impact on depY. *The relative impac
- Page 210 and 211:
Appendix *The impact of the destina
- Page 212 and 213:
vector d = d1 to d6. vector p = p1
- Page 214 and 215:
*and with constraints our model wou
- Page 216 and 217:
Appendix 215
- Page 218 and 219:
Appendix 3.1 continued father’s s
- Page 220 and 221:
APPENDIX 3.3 OPPOSITION TO ETHNIC I
- Page 222 and 223:
Appendix Appendix 4.1 continued Eco
- Page 224 and 225:
Appendix APPENDIX 4.3 VARIANCE COMP
- Page 226 and 227:
Appendix 5.1 continued Ethnicity N
- Page 228 and 229:
APPENDIX 5.3 ROBUSTNESS OF ES ASSOC
- Page 230 and 231:
Appendix APPENDIX 5.5 MULTI-NOMINAL
- Page 232 and 233:
Appendix 7.1 continued 2nd gen. 2nd
- Page 234 and 235:
Appendix 233
- Page 236 and 237:
BIBLIOGRAPHY Bibliography Abu-Rayya
- Page 238 and 239:
Bibliography Buijs, F. J., Demant,
- Page 240 and 241:
Bibliography (pp. 345-383). Oxford:
- Page 242 and 243:
Bibliography euthanasia, homosexual
- Page 244 and 245:
Bibliography Onderzoek (ISEO). Mart
- Page 246 and 247:
Bibliography Politics, 58(1), 41-72
- Page 248 and 249:
Bibliography Worchel (Eds.), The so
- Page 250 and 251:
Bibliography 249
- Page 252 and 253:
Summary in Dutch / Nederlandstalige
- Page 254 and 255:
Summary in Dutch / Nederlandstalige
- Page 256 and 257:
Summary in Dutch / Nederlandstalige
- Page 258 and 259:
Summary in Dutch / Nederlandstalige
- Page 260 and 261:
Summary in Dutch / Nederlandstalige
- Page 262 and 263:
Summary in Dutch / Nederlandstalige
- Page 264 and 265:
CURRICULUM VITAE Curriculum Vitae J
- Page 266 and 267:
ICS DISSERTATION SERIES ICS dissert
- Page 268 and 269:
ICS dissertation series 37) Andreas
- Page 270 and 271:
ICS dissertation series 76) Inge Si
- Page 272 and 273:
ICS dissertation series 115) Martin
- Page 274:
Why do some individuals express mor