PV*SOL Expert 6.0 - Manual - Valentin Software
PV*SOL Expert 6.0 - Manual - Valentin Software
PV*SOL Expert 6.0 - Manual - Valentin Software

Create successful ePaper yourself
Turn your PDF publications into a flip-book with our unique Google optimized e-Paper software.
12.2.1 Graphics Screen<br />
Legend<br />
This field contains a description for each data record being displayed.<br />
If energies are illustrated, the sum of the energy in the selected period is shown next to<br />
the name of the data record.<br />
Power output, temperatures, wind speed and evaluation quantities (energy coverage,<br />
performance ratios and efficiencies) are displayed as mean values for the period.<br />
Title<br />
Give the graph or chart a new title by double clicking on the title frame. A dialog window<br />
opens. When you close this window the new title appears in the title frame. Drag and drop<br />
the title to any position within the graphics window.<br />
Co-ordinates Field<br />
At the base of the graphics window a field displays the actual co-ordinates indicated by<br />
the mouse pointer when it is located within the diagram. The date and time, as well as the<br />
x-value for the position of the mouse pointer are shown.<br />
Selecting and Amending the Data and Axes<br />
Select the individual data records or the x and y-axes by a single click of the left mouse<br />
button. The selection is shown by points along the lines in a line graph and on the bars in a<br />
bar chart. Click just below the lines for a line graph and the x axis, just under the top of<br />
one of the bars for a bar chart and to the left of the line for the y-axis.<br />
By double clicking on the x or y-axes the dialog window Formatting the X-Axis or<br />
Formatting the Y-Axis appears.<br />
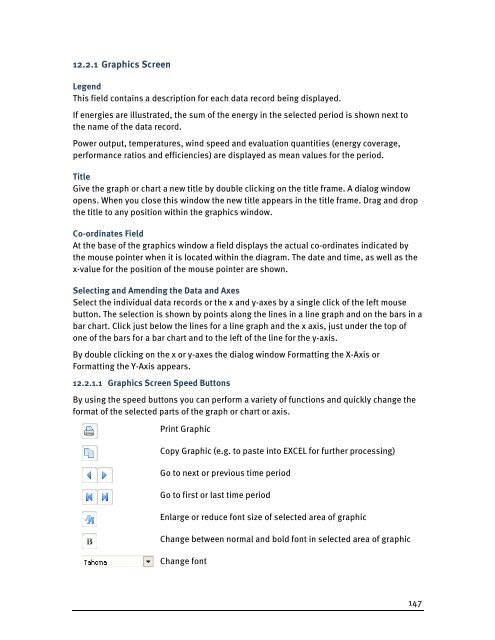
12.2.1.1 Graphics Screen Speed Buttons<br />
By using the speed buttons you can perform a variety of functions and quickly change the<br />
format of the selected parts of the graph or chart or axis.<br />
Print Graphic<br />
Copy Graphic (e.g. to paste into EXCEL for further processing)<br />
Go to next or previous time period<br />
Go to first or last time period<br />
Enlarge or reduce font size of selected area of graphic<br />
Change between normal and bold font in selected area of graphic<br />
Change font<br />
147